
 Yahoo Finance
 Capricorn Metals' (ASX:CMM) Returns On Capital Are Heading Higher
There are a few key trends to look for if we want to identify the next multi-bagger. Firstly, we'll want to see a proven return on capital employed (ROCE) that is increasing, and secondly, an expanding base of capital employed. Put simply, these types of businesses are compounding machines, meaning they are continually reinvesting their earnings at ever-higher rates of return. So when we looked at Capricorn Metals (ASX:CMM) and its trend of ROCE, we really liked what we saw.
Understanding Return On Capital Employed (ROCE)
Just to clarify if you're unsure, ROCE is a metric for evaluating how much pre-tax income (in percentage terms) a company earns on the capital invested in its business. Analysts use this formula to calculate it for Capricorn Metals:
Return on Capital Employed = Earnings Before Interest and Tax (EBIT) ÷ (Total Assets - Current Liabilities)
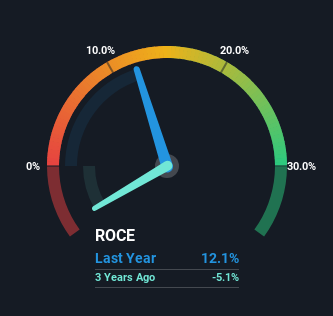
0.12 = AU$69m ÷ (AU$619m - AU$48m) (Based on the trailing twelve months to December 2023).
Therefore, Capricorn Metals has an ROCE of 12%. In absolute terms, that's a pretty normal return, and it's somewhat close to the Metals and Mining industry average of 11%.
View our latest analysis for Capricorn Metals
Above you can see how the current ROCE for Capricorn Metals compares to its prior returns on capital, but there's only so much you can tell from the past. If you're interested, you can view the analysts predictions in our free analyst report for Capricorn Metals .
So How Is Capricorn Metals' ROCE Trending?
The fact that Capricorn Metals is now generating some pre-tax profits from its prior investments is very encouraging. About five years ago the company was generating losses but things have turned around because it's now earning 12% on its capital. In addition to that, Capricorn Metals is employing 1,553% more capital than previously which is expected of a company that's trying to break into profitability. This can indicate that there's plenty of opportunities to invest capital internally and at ever higher rates, both common traits of a multi-bagger.
In Conclusion...
To the delight of most shareholders, Capricorn Metals has now broken into profitability. Since the stock has returned a staggering 1,358% to shareholders over the last five years, it looks like investors are recognizing these changes. With that being said, we still think the promising fundamentals mean the company deserves some further due diligence.
Like most companies, Capricorn Metals does come with some risks, and we've found 2 warning signs that you should be aware of.
If you want to search for solid companies with great earnings, check out this free list of companies with good balance sheets and impressive returns on equity.
Have feedback on this article? Concerned about the content? Get in touch with us directly. Alternatively, email editorial-team (at) simplywallst.com.
This article by Simply Wall St is general in nature. We provide commentary based on historical data and analyst forecasts only using an unbiased methodology and our articles are not intended to be financial advice. It does not constitute a recommendation to buy or sell any stock, and does not take account of your objectives, or your financial situation. We aim to bring you long-term focused analysis driven by fundamental data. Note that our analysis may not factor in the latest price-sensitive company announcements or qualitative material. Simply Wall St has no position in any stocks mentioned.
