
 Yahoo Finance
 Capital Allocation Trends At Neo Performance Materials (TSE:NEO) Aren't Ideal
When researching a stock for investment, what can tell us that the company is in decline? A business that's potentially in decline often shows two trends, a return on capital employed (ROCE) that's declining, and a base of capital employed that's also declining. This combination can tell you that not only is the company investing less, it's earning less on what it does invest. And from a first read, things don't look too good at Neo Performance Materials (TSE:NEO), so let's see why.
Understanding Return On Capital Employed (ROCE)
For those that aren't sure what ROCE is, it measures the amount of pre-tax profits a company can generate from the capital employed in its business. Analysts use this formula to calculate it for Neo Performance Materials:
Return on Capital Employed = Earnings Before Interest and Tax (EBIT) ÷ (Total Assets - Current Liabilities)
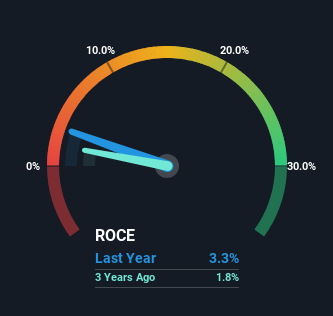
0.033 = US$17m ÷ (US$627m - US$123m) (Based on the trailing twelve months to December 2023).
Thus, Neo Performance Materials has an ROCE of 3.3%. Ultimately, that's a low return and it under-performs the Chemicals industry average of 8.2%.
See our latest analysis for Neo Performance Materials
Above you can see how the current ROCE for Neo Performance Materials compares to its prior returns on capital, but there's only so much you can tell from the past. If you're interested, you can view the analysts predictions in our free analyst report for Neo Performance Materials .
The Trend Of ROCE
There is reason to be cautious about Neo Performance Materials, given the returns are trending downwards. Unfortunately the returns on capital have diminished from the 9.7% that they were earning five years ago. Meanwhile, capital employed in the business has stayed roughly the flat over the period. This combination can be indicative of a mature business that still has areas to deploy capital, but the returns received aren't as high due potentially to new competition or smaller margins. If these trends continue, we wouldn't expect Neo Performance Materials to turn into a multi-bagger.
The Bottom Line On Neo Performance Materials' ROCE
In summary, it's unfortunate that Neo Performance Materials is generating lower returns from the same amount of capital. Long term shareholders who've owned the stock over the last five years have experienced a 42% depreciation in their investment, so it appears the market might not like these trends either. With underlying trends that aren't great in these areas, we'd consider looking elsewhere.
Like most companies, Neo Performance Materials does come with some risks, and we've found 1 warning sign that you should be aware of.
While Neo Performance Materials isn't earning the highest return, check out this free list of companies that are earning high returns on equity with solid balance sheets.
Have feedback on this article? Concerned about the content? Get in touch with us directly. Alternatively, email editorial-team (at) simplywallst.com.
This article by Simply Wall St is general in nature. We provide commentary based on historical data and analyst forecasts only using an unbiased methodology and our articles are not intended to be financial advice. It does not constitute a recommendation to buy or sell any stock, and does not take account of your objectives, or your financial situation. We aim to bring you long-term focused analysis driven by fundamental data. Note that our analysis may not factor in the latest price-sensitive company announcements or qualitative material. Simply Wall St has no position in any stocks mentioned.
