
 Yahoo Finance
 Capital Allocation Trends At N2N Connect Berhad (KLSE:N2N) Aren't Ideal
When researching a stock for investment, what can tell us that the company is in decline? A business that's potentially in decline often shows two trends, a return on capital employed (ROCE) that's declining, and a base of capital employed that's also declining. This reveals that the company isn't compounding shareholder wealth because returns are falling and its net asset base is shrinking. In light of that, from a first glance at N2N Connect Berhad (KLSE:N2N), we've spotted some signs that it could be struggling, so let's investigate.
What Is Return On Capital Employed (ROCE)?
For those who don't know, ROCE is a measure of a company's yearly pre-tax profit (its return), relative to the capital employed in the business. The formula for this calculation on N2N Connect Berhad is:
Return on Capital Employed = Earnings Before Interest and Tax (EBIT) ÷ (Total Assets - Current Liabilities)
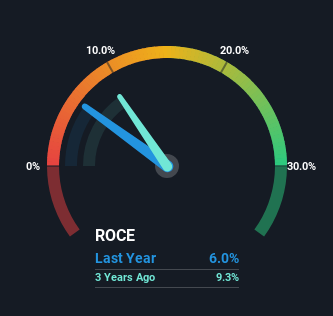
0.06 = RM18m ÷ (RM324m - RM22m) (Based on the trailing twelve months to December 2023).
So, N2N Connect Berhad has an ROCE of 6.0%. In absolute terms, that's a low return and it also under-performs the Software industry average of 9.0%.
See our latest analysis for N2N Connect Berhad
While the past is not representative of the future, it can be helpful to know how a company has performed historically, which is why we have this chart above. If you're interested in investigating N2N Connect Berhad's past further, check out this free graph covering N2N Connect Berhad's past earnings, revenue and cash flow.
The Trend Of ROCE
We are a bit worried about the trend of returns on capital at N2N Connect Berhad. To be more specific, the ROCE was 7.8% five years ago, but since then it has dropped noticeably. Meanwhile, capital employed in the business has stayed roughly the flat over the period. Companies that exhibit these attributes tend to not be shrinking, but they can be mature and facing pressure on their margins from competition. So because these trends aren't typically conducive to creating a multi-bagger, we wouldn't hold our breath on N2N Connect Berhad becoming one if things continue as they have.
The Key Takeaway
All in all, the lower returns from the same amount of capital employed aren't exactly signs of a compounding machine. It should come as no surprise then that the stock has fallen 26% over the last five years, so it looks like investors are recognizing these changes. That being the case, unless the underlying trends revert to a more positive trajectory, we'd consider looking elsewhere.
On a final note, we've found 2 warning signs for N2N Connect Berhad that we think you should be aware of.
For those who like to invest in solid companies, check out this free list of companies with solid balance sheets and high returns on equity.
Have feedback on this article? Concerned about the content? Get in touch with us directly. Alternatively, email editorial-team (at) simplywallst.com.
This article by Simply Wall St is general in nature. We provide commentary based on historical data and analyst forecasts only using an unbiased methodology and our articles are not intended to be financial advice. It does not constitute a recommendation to buy or sell any stock, and does not take account of your objectives, or your financial situation. We aim to bring you long-term focused analysis driven by fundamental data. Note that our analysis may not factor in the latest price-sensitive company announcements or qualitative material. Simply Wall St has no position in any stocks mentioned.
