
 Yahoo Finance
 Capital Allocation Trends At Integral Diagnostics (ASX:IDX) Aren't Ideal
What trends should we look for it we want to identify stocks that can multiply in value over the long term? Ideally, a business will show two trends; firstly a growing return on capital employed (ROCE) and secondly, an increasing amount of capital employed. If you see this, it typically means it's a company with a great business model and plenty of profitable reinvestment opportunities. However, after investigating Integral Diagnostics (ASX:IDX), we don't think it's current trends fit the mold of a multi-bagger.
What Is Return On Capital Employed (ROCE)?
Just to clarify if you're unsure, ROCE is a metric for evaluating how much pre-tax income (in percentage terms) a company earns on the capital invested in its business. The formula for this calculation on Integral Diagnostics is:
Return on Capital Employed = Earnings Before Interest and Tax (EBIT) ÷ (Total Assets - Current Liabilities)
0.064 = AU$42m ÷ (AU$746m - AU$86m) (Based on the trailing twelve months to December 2023).
Thus, Integral Diagnostics has an ROCE of 6.4%. On its own that's a low return on capital but it's in line with the industry's average returns of 6.4%.
See our latest analysis for Integral Diagnostics
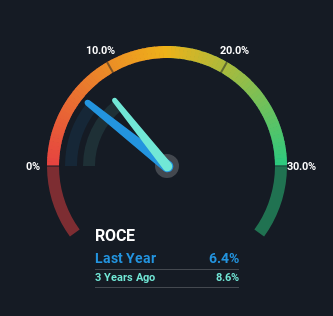
Above you can see how the current ROCE for Integral Diagnostics compares to its prior returns on capital, but there's only so much you can tell from the past. If you'd like, you can check out the forecasts from the analysts covering Integral Diagnostics for free.
What Can We Tell From Integral Diagnostics' ROCE Trend?
On the surface, the trend of ROCE at Integral Diagnostics doesn't inspire confidence. Over the last five years, returns on capital have decreased to 6.4% from 12% five years ago. However, given capital employed and revenue have both increased it appears that the business is currently pursuing growth, at the consequence of short term returns. And if the increased capital generates additional returns, the business, and thus shareholders, will benefit in the long run.
The Bottom Line On Integral Diagnostics' ROCE
In summary, despite lower returns in the short term, we're encouraged to see that Integral Diagnostics is reinvesting for growth and has higher sales as a result. However, total returns to shareholders over the last five years have been flat, which could indicate these growth trends potentially aren't accounted for yet by investors. So we think it'd be worthwhile to look further into this stock given the trends look encouraging.
One final note, you should learn about the 2 warning signs we've spotted with Integral Diagnostics (including 1 which doesn't sit too well with us) .
If you want to search for solid companies with great earnings, check out this free list of companies with good balance sheets and impressive returns on equity.
Have feedback on this article? Concerned about the content? Get in touch with us directly. Alternatively, email editorial-team (at) simplywallst.com.
This article by Simply Wall St is general in nature. We provide commentary based on historical data and analyst forecasts only using an unbiased methodology and our articles are not intended to be financial advice. It does not constitute a recommendation to buy or sell any stock, and does not take account of your objectives, or your financial situation. We aim to bring you long-term focused analysis driven by fundamental data. Note that our analysis may not factor in the latest price-sensitive company announcements or qualitative material. Simply Wall St has no position in any stocks mentioned.
