
 Yahoo Finance
 Capital Allocation Trends At Fox (NASDAQ:FOXA) Aren't Ideal
If you're looking for a multi-bagger, there's a few things to keep an eye out for. Ideally, a business will show two trends; firstly a growing return on capital employed (ROCE) and secondly, an increasing amount of capital employed. This shows us that it's a compounding machine, able to continually reinvest its earnings back into the business and generate higher returns. However, after briefly looking over the numbers, we don't think Fox (NASDAQ:FOXA) has the makings of a multi-bagger going forward, but let's have a look at why that may be.
What Is Return On Capital Employed (ROCE)?
If you haven't worked with ROCE before, it measures the 'return' (pre-tax profit) a company generates from capital employed in its business. Analysts use this formula to calculate it for Fox:
Return on Capital Employed = Earnings Before Interest and Tax (EBIT) ÷ (Total Assets - Current Liabilities)
0.12 = US$2.3b ÷ (US$23b - US$3.7b) (Based on the trailing twelve months to December 2023).
Therefore, Fox has an ROCE of 12%. In absolute terms, that's a satisfactory return, but compared to the Media industry average of 8.8% it's much better.
View our latest analysis for Fox
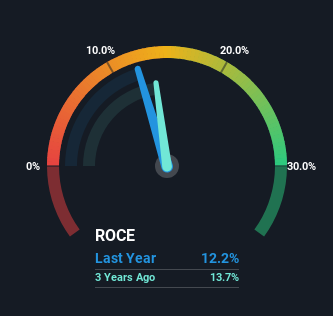
Above you can see how the current ROCE for Fox compares to its prior returns on capital, but there's only so much you can tell from the past. If you'd like, you can check out the forecasts from the analysts covering Fox for free.
What The Trend Of ROCE Can Tell Us
In terms of Fox's historical ROCE movements, the trend isn't fantastic. To be more specific, ROCE has fallen from 19% over the last five years. On the other hand, the company has been employing more capital without a corresponding improvement in sales in the last year, which could suggest these investments are longer term plays. It may take some time before the company starts to see any change in earnings from these investments.
The Bottom Line
In summary, Fox is reinvesting funds back into the business for growth but unfortunately it looks like sales haven't increased much just yet. And investors appear hesitant that the trends will pick up because the stock has fallen 13% in the last five years. Therefore based on the analysis done in this article, we don't think Fox has the makings of a multi-bagger.
Since virtually every company faces some risks, it's worth knowing what they are, and we've spotted 4 warning signs for Fox (of which 1 is a bit unpleasant!) that you should know about.
While Fox may not currently earn the highest returns, we've compiled a list of companies that currently earn more than 25% return on equity. Check out this free list here.
Have feedback on this article? Concerned about the content? Get in touch with us directly. Alternatively, email editorial-team (at) simplywallst.com.
This article by Simply Wall St is general in nature. We provide commentary based on historical data and analyst forecasts only using an unbiased methodology and our articles are not intended to be financial advice. It does not constitute a recommendation to buy or sell any stock, and does not take account of your objectives, or your financial situation. We aim to bring you long-term focused analysis driven by fundamental data. Note that our analysis may not factor in the latest price-sensitive company announcements or qualitative material. Simply Wall St has no position in any stocks mentioned.
