
 Yahoo Finance
 Capital Allocation Trends At Brisbane Broncos (ASX:BBL) Aren't Ideal
If you're not sure where to start when looking for the next multi-bagger, there are a few key trends you should keep an eye out for. One common approach is to try and find a company with returns on capital employed (ROCE) that are increasing, in conjunction with a growing amount of capital employed. Put simply, these types of businesses are compounding machines, meaning they are continually reinvesting their earnings at ever-higher rates of return. Although, when we looked at Brisbane Broncos (ASX:BBL), it didn't seem to tick all of these boxes.
Understanding Return On Capital Employed (ROCE)
For those that aren't sure what ROCE is, it measures the amount of pre-tax profits a company can generate from the capital employed in its business. Analysts use this formula to calculate it for Brisbane Broncos:
Return on Capital Employed = Earnings Before Interest and Tax (EBIT) ÷ (Total Assets - Current Liabilities)
0.056 = AU$2.3m ÷ (AU$56m - AU$16m) (Based on the trailing twelve months to June 2021).
Therefore, Brisbane Broncos has an ROCE of 5.6%. In absolute terms, that's a low return and it also under-performs the Entertainment industry average of 9.4%.
View our latest analysis for Brisbane Broncos
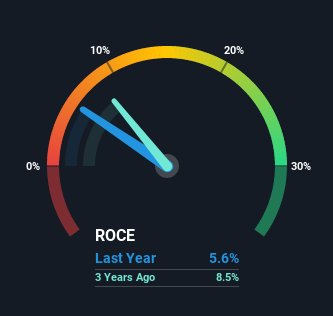
Historical performance is a great place to start when researching a stock so above you can see the gauge for Brisbane Broncos' ROCE against it's prior returns. If you want to delve into the historical earnings, revenue and cash flow of Brisbane Broncos, check out these free graphs here.
The Trend Of ROCE
In terms of Brisbane Broncos' historical ROCE movements, the trend isn't fantastic. Over the last five years, returns on capital have decreased to 5.6% from 12% five years ago. However it looks like Brisbane Broncos might be reinvesting for long term growth because while capital employed has increased, the company's sales haven't changed much in the last 12 months. It's worth keeping an eye on the company's earnings from here on to see if these investments do end up contributing to the bottom line.
The Bottom Line
In summary, Brisbane Broncos is reinvesting funds back into the business for growth but unfortunately it looks like sales haven't increased much just yet. Although the market must be expecting these trends to improve because the stock has gained 51% over the last five years. But if the trajectory of these underlying trends continue, we think the likelihood of it being a multi-bagger from here isn't high.
Since virtually every company faces some risks, it's worth knowing what they are, and we've spotted 2 warning signs for Brisbane Broncos (of which 1 is a bit concerning!) that you should know about.
While Brisbane Broncos may not currently earn the highest returns, we've compiled a list of companies that currently earn more than 25% return on equity. Check out this free list here.
This article by Simply Wall St is general in nature. We provide commentary based on historical data and analyst forecasts only using an unbiased methodology and our articles are not intended to be financial advice. It does not constitute a recommendation to buy or sell any stock, and does not take account of your objectives, or your financial situation. We aim to bring you long-term focused analysis driven by fundamental data. Note that our analysis may not factor in the latest price-sensitive company announcements or qualitative material. Simply Wall St has no position in any stocks mentioned.
Have feedback on this article? Concerned about the content? Get in touch with us directly. Alternatively, email editorial-team (at) simplywallst.com.
