
 Yahoo Finance
 Cango's (NYSE:CANG) Returns On Capital Tell Us There Is Reason To Feel Uneasy
What financial metrics can indicate to us that a company is maturing or even in decline? Businesses in decline often have two underlying trends, firstly, a declining return on capital employed (ROCE) and a declining base of capital employed. Trends like this ultimately mean the business is reducing its investments and also earning less on what it has invested. So after glancing at the trends within Cango (NYSE:CANG), we weren't too hopeful.
Return On Capital Employed (ROCE): What Is It?
For those who don't know, ROCE is a measure of a company's yearly pre-tax profit (its return), relative to the capital employed in the business. To calculate this metric for Cango, this is the formula:
Return on Capital Employed = Earnings Before Interest and Tax (EBIT) ÷ (Total Assets - Current Liabilities)
0.026 = CN¥101m ÷ (CN¥4.6b - CN¥778m) (Based on the trailing twelve months to December 2023).
So, Cango has an ROCE of 2.6%. Ultimately, that's a low return and it under-performs the Specialty Retail industry average of 14%.
View our latest analysis for Cango
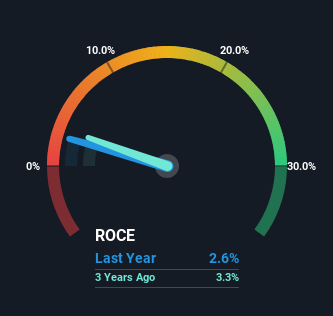
Historical performance is a great place to start when researching a stock so above you can see the gauge for Cango's ROCE against it's prior returns. If you're interested in investigating Cango's past further, check out this free graph covering Cango's past earnings, revenue and cash flow.
What The Trend Of ROCE Can Tell Us
The trend of returns that Cango is generating are raising some concerns. Unfortunately, returns have declined substantially over the last five years to the 2.6% we see today. In addition to that, Cango is now employing 33% less capital than it was five years ago. When you see both ROCE and capital employed diminishing, it can often be a sign of a mature and shrinking business that might be in structural decline. Typically businesses that exhibit these characteristics aren't the ones that tend to multiply over the long term, because statistically speaking, they've already gone through the growth phase of their life cycle.
The Key Takeaway
In short, lower returns and decreasing amounts capital employed in the business doesn't fill us with confidence. It should come as no surprise then that the stock has fallen 42% over the last five years, so it looks like investors are recognizing these changes. Unless there is a shift to a more positive trajectory in these metrics, we would look elsewhere.
One final note, you should learn about the 2 warning signs we've spotted with Cango (including 1 which can't be ignored) .
While Cango may not currently earn the highest returns, we've compiled a list of companies that currently earn more than 25% return on equity. Check out this free list here.
Have feedback on this article? Concerned about the content? Get in touch with us directly. Alternatively, email editorial-team (at) simplywallst.com.
This article by Simply Wall St is general in nature. We provide commentary based on historical data and analyst forecasts only using an unbiased methodology and our articles are not intended to be financial advice. It does not constitute a recommendation to buy or sell any stock, and does not take account of your objectives, or your financial situation. We aim to bring you long-term focused analysis driven by fundamental data. Note that our analysis may not factor in the latest price-sensitive company announcements or qualitative material. Simply Wall St has no position in any stocks mentioned.
