
 Yahoo Finance
 Is Caltex Australia Limited (ASX:CTX) Struggling With Its 10.0% Return On Capital Employed?

Today we'll look at Caltex Australia Limited (ASX:CTX) and reflect on its potential as an investment. Specifically, we're going to calculate its Return On Capital Employed (ROCE), in the hopes of getting some insight into the business.
Firstly, we'll go over how we calculate ROCE. Second, we'll look at its ROCE compared to similar companies. Last but not least, we'll look at what impact its current liabilities have on its ROCE.
What is Return On Capital Employed (ROCE)?
ROCE is a measure of a company's yearly pre-tax profit (its return), relative to the capital employed in the business. In general, businesses with a higher ROCE are usually better quality. In brief, it is a useful tool, but it is not without drawbacks. Renowned investment researcher Michael Mauboussin has suggested that a high ROCE can indicate that 'one dollar invested in the company generates value of more than one dollar'.
How Do You Calculate Return On Capital Employed?
Analysts use this formula to calculate return on capital employed:
Return on Capital Employed = Earnings Before Interest and Tax (EBIT) ÷ (Total Assets - Current Liabilities)
Or for Caltex Australia:
0.10 = AU$536m ÷ (AU$8.0b - AU$2.6b) (Based on the trailing twelve months to June 2019.)
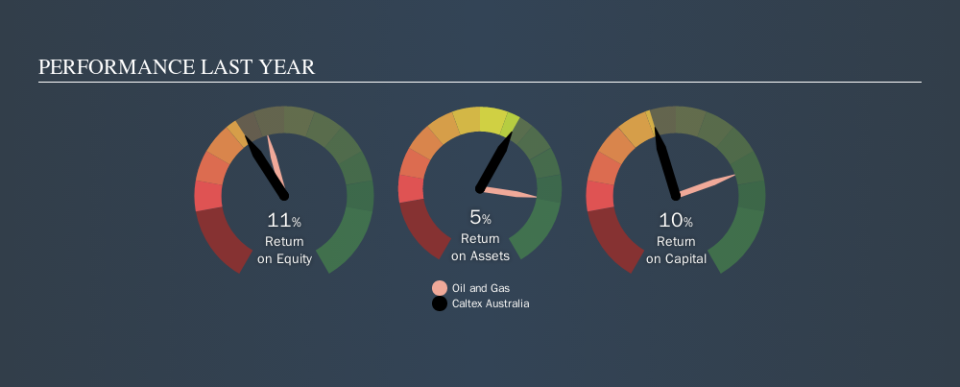
So, Caltex Australia has an ROCE of 10.0%.
See our latest analysis for Caltex Australia
Does Caltex Australia Have A Good ROCE?
One way to assess ROCE is to compare similar companies. In this analysis, Caltex Australia's ROCE appears meaningfully below the 13% average reported by the Oil and Gas industry. This performance is not ideal, as it suggests the company may not be deploying its capital as effectively as some competitors. Separate from how Caltex Australia stacks up against its industry, its ROCE in absolute terms is mediocre; relative to the returns on government bonds. It is possible that there are more rewarding investments out there.
Caltex Australia's current ROCE of 10.0% is lower than 3 years ago, when the company reported a 20% ROCE. Therefore we wonder if the company is facing new headwinds. The image below shows how Caltex Australia's ROCE compares to its industry, and you can click it to see more detail on its past growth.
It is important to remember that ROCE shows past performance, and is not necessarily predictive. ROCE can be deceptive for cyclical businesses, as returns can look incredible in boom times, and terribly low in downturns. This is because ROCE only looks at one year, instead of considering returns across a whole cycle. Remember that most companies like Caltex Australia are cyclical businesses. Future performance is what matters, and you can see analyst predictions in our free report on analyst forecasts for the company.
Caltex Australia's Current Liabilities And Their Impact On Its ROCE
Short term (or current) liabilities, are things like supplier invoices, overdrafts, or tax bills that need to be paid within 12 months. Due to the way the ROCE equation works, having large bills due in the near term can make it look as though a company has less capital employed, and thus a higher ROCE than usual. To check the impact of this, we calculate if a company has high current liabilities relative to its total assets.
Caltex Australia has total liabilities of AU$2.6b and total assets of AU$8.0b. Therefore its current liabilities are equivalent to approximately 33% of its total assets. Caltex Australia's ROCE is improved somewhat by its moderate amount of current liabilities.
What We Can Learn From Caltex Australia's ROCE
With this level of liabilities and a mediocre ROCE, there are potentially better investments out there. You might be able to find a better investment than Caltex Australia. If you want a selection of possible winners, check out this free list of interesting companies that trade on a P/E below 20 (but have proven they can grow earnings).
If you are like me, then you will not want to miss this free list of growing companies that insiders are buying.
We aim to bring you long-term focused research analysis driven by fundamental data. Note that our analysis may not factor in the latest price-sensitive company announcements or qualitative material.
If you spot an error that warrants correction, please contact the editor at editorial-team@simplywallst.com. This article by Simply Wall St is general in nature. It does not constitute a recommendation to buy or sell any stock, and does not take account of your objectives, or your financial situation. Simply Wall St has no position in the stocks mentioned. Thank you for reading.
