
 Yahoo Finance
 Calima Energy Limited's (ASX:CE1) Shares Not Telling The Full Story
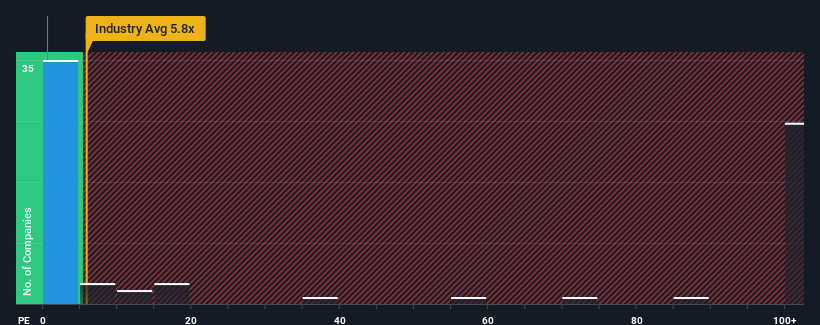
You may think that with a price-to-sales (or "P/S") ratio of 0.5x Calima Energy Limited (ASX:CE1) is definitely a stock worth checking out, seeing as almost half of all the Oil and Gas companies in Australia have P/S ratios greater than 5.8x and even P/S above 1063x aren't out of the ordinary. Nonetheless, we'd need to dig a little deeper to determine if there is a rational basis for the highly reduced P/S.
Check out our latest analysis for Calima Energy
What Does Calima Energy's P/S Mean For Shareholders?
Calima Energy certainly has been doing a good job lately as it's been growing revenue more than most other companies. One possibility is that the P/S ratio is low because investors think this strong revenue performance might be less impressive moving forward. If not, then existing shareholders have reason to be quite optimistic about the future direction of the share price.
Keen to find out how analysts think Calima Energy's future stacks up against the industry? In that case, our free report is a great place to start.
Is There Any Revenue Growth Forecasted For Calima Energy?
There's an inherent assumption that a company should far underperform the industry for P/S ratios like Calima Energy's to be considered reasonable.
Retrospectively, the last year delivered an exceptional 156% gain to the company's top line. Spectacularly, three year revenue growth has ballooned by several orders of magnitude, thanks in part to the last 12 months of revenue growth. So we can start by confirming that the company has done a tremendous job of growing revenue over that time.
Looking ahead now, revenue is anticipated to remain buoyant, climbing by 31% during the coming year according to the sole analyst following the company. Meanwhile, the broader industry is forecast to contract by 0.7%, which would indicate the company is doing very well.
With this in mind, we find it intriguing that Calima Energy's P/S falls short of its industry peers. It looks like most investors aren't convinced at all that the company can achieve positive future growth in the face of a shrinking broader industry.
What Does Calima Energy's P/S Mean For Investors?
It's argued the price-to-sales ratio is an inferior measure of value within certain industries, but it can be a powerful business sentiment indicator.
We've established that Calima Energy currently trades on a much lower than expected P/S since its growth forecasts are potentially beating a struggling industry. There could be some major unobserved threats to revenue preventing the P/S ratio from matching the positive outlook. Amidst challenging industry conditions, a key concern is whether the company can sustain its superior revenue growth trajectory. So, the risk of a price drop looks to be subdued, but investors seem to think future revenue could see a lot of volatility.
It's always necessary to consider the ever-present spectre of investment risk. We've identified 1 warning sign with Calima Energy, and understanding should be part of your investment process.
If companies with solid past earnings growth is up your alley, you may wish to see this free collection of other companies with strong earnings growth and low P/E ratios.
Have feedback on this article? Concerned about the content? Get in touch with us directly. Alternatively, email editorial-team (at) simplywallst.com.
This article by Simply Wall St is general in nature. We provide commentary based on historical data and analyst forecasts only using an unbiased methodology and our articles are not intended to be financial advice. It does not constitute a recommendation to buy or sell any stock, and does not take account of your objectives, or your financial situation. We aim to bring you long-term focused analysis driven by fundamental data. Note that our analysis may not factor in the latest price-sensitive company announcements or qualitative material. Simply Wall St has no position in any stocks mentioned.
