
 Yahoo Finance
 Calima Energy Full Year 2022 Earnings: EPS: AU$0.038 (vs AU$0.084 loss in FY 2021)
Calima Energy (ASX:CE1) Full Year 2022 Results
Key Financial Results
Revenue: AU$98.9m (up 156% from FY 2021).
Net income: AU$22.8m (up from AU$32.0m loss in FY 2021).
Profit margin: 23% (up from net loss in FY 2021). The move to profitability was driven by higher revenue.
EPS: AU$0.038 (up from AU$0.084 loss in FY 2021).
CE1 Production and Reserves
Oil Reserves and Sales Price
Proven reserves: 10.163 MMbbls.
Average sales price/bbl (hedged): US$112.
Gas Reserves and Sales Price
Proven reserves: 35.477 Bcf.
Average sales price/mcf (hedged): US$6.11.
LNG Sales Price
Average sales price/bbl (hedged): US$81.86.
Combined production
Oil equivalent production: 1.431 MMboe.
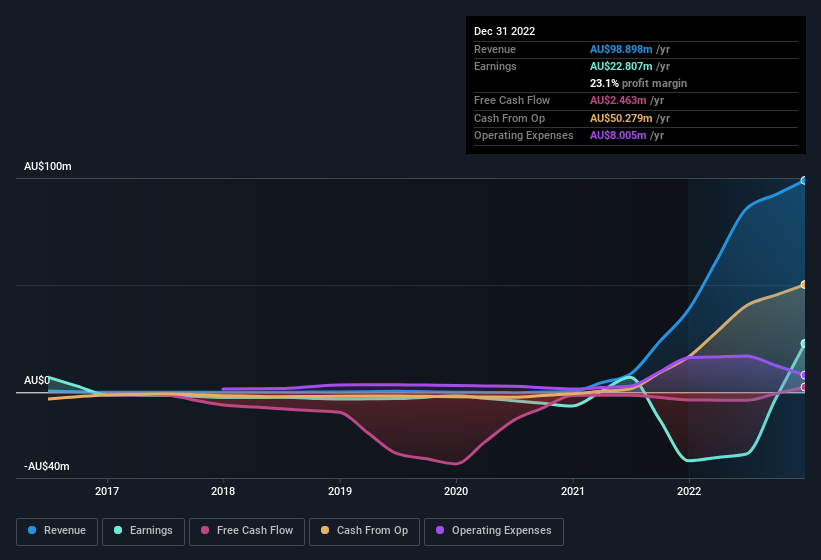
All figures shown in the chart above are for the trailing 12 month (TTM) period
Calima Energy Earnings Insights
Looking ahead, revenue is forecast to grow 19% p.a. on average during the next 3 years, compared to a 1.6% decline forecast for the Oil and Gas industry in Australia.
Performance of the Australian Oil and Gas industry.
The company's shares are up 8.7% from a week ago.
Risk Analysis
You still need to take note of risks, for example - Calima Energy has 1 warning sign we think you should be aware of.
Have feedback on this article? Concerned about the content? Get in touch with us directly. Alternatively, email editorial-team (at) simplywallst.com.
This article by Simply Wall St is general in nature. We provide commentary based on historical data and analyst forecasts only using an unbiased methodology and our articles are not intended to be financial advice. It does not constitute a recommendation to buy or sell any stock, and does not take account of your objectives, or your financial situation. We aim to bring you long-term focused analysis driven by fundamental data. Note that our analysis may not factor in the latest price-sensitive company announcements or qualitative material. Simply Wall St has no position in any stocks mentioned.
Join A Paid User Research Session
You’ll receive a US$30 Amazon Gift card for 1 hour of your time while helping us build better investing tools for the individual investors like yourself. Sign up here
