
 Yahoo Finance
 Caffyns (LON:CFYN) Is Experiencing Growth In Returns On Capital
If we want to find a stock that could multiply over the long term, what are the underlying trends we should look for? Firstly, we'll want to see a proven return on capital employed (ROCE) that is increasing, and secondly, an expanding base of capital employed. Put simply, these types of businesses are compounding machines, meaning they are continually reinvesting their earnings at ever-higher rates of return. So when we looked at Caffyns (LON:CFYN) and its trend of ROCE, we really liked what we saw.
Return On Capital Employed (ROCE): What is it?
If you haven't worked with ROCE before, it measures the 'return' (pre-tax profit) a company generates from capital employed in its business. The formula for this calculation on Caffyns is:
Return on Capital Employed = Earnings Before Interest and Tax (EBIT) ÷ (Total Assets - Current Liabilities)
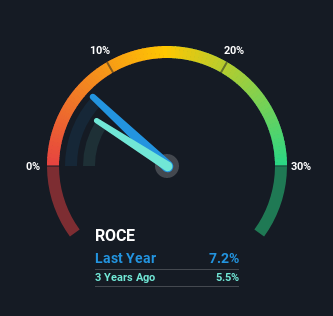
0.072 = UK£3.6m ÷ (UK£84m - UK£33m) (Based on the trailing twelve months to September 2021).
Thus, Caffyns has an ROCE of 7.2%. Ultimately, that's a low return and it under-performs the Specialty Retail industry average of 14%.
See our latest analysis for Caffyns
While the past is not representative of the future, it can be helpful to know how a company has performed historically, which is why we have this chart above. If you'd like to look at how Caffyns has performed in the past in other metrics, you can view this free graph of past earnings, revenue and cash flow.
What Does the ROCE Trend For Caffyns Tell Us?
Caffyns is showing promise given that its ROCE is trending up and to the right. Looking at the data, we can see that even though capital employed in the business has remained relatively flat, the ROCE generated has risen by 65% over the last five years. Basically the business is generating higher returns from the same amount of capital and that is proof that there are improvements in the company's efficiencies. On that front, things are looking good so it's worth exploring what management has said about growth plans going forward.
The Bottom Line On Caffyns' ROCE
As discussed above, Caffyns appears to be getting more proficient at generating returns since capital employed has remained flat but earnings (before interest and tax) are up. Investors may not be impressed by the favorable underlying trends yet because over the last five years the stock has only returned 13% to shareholders. So with that in mind, we think the stock deserves further research.
If you want to know some of the risks facing Caffyns we've found 3 warning signs (1 is concerning!) that you should be aware of before investing here.
While Caffyns isn't earning the highest return, check out this free list of companies that are earning high returns on equity with solid balance sheets.
This article by Simply Wall St is general in nature. We provide commentary based on historical data and analyst forecasts only using an unbiased methodology and our articles are not intended to be financial advice. It does not constitute a recommendation to buy or sell any stock, and does not take account of your objectives, or your financial situation. We aim to bring you long-term focused analysis driven by fundamental data. Note that our analysis may not factor in the latest price-sensitive company announcements or qualitative material. Simply Wall St has no position in any stocks mentioned.
Have feedback on this article? Concerned about the content? Get in touch with us directly. Alternatively, email editorial-team (at) simplywallst.com.
