
 Yahoo Finance
 Should You Buy Z Energy Limited (NZSE:ZEL) For Its Dividend?
Dividend paying stocks like Z Energy Limited (NZSE:ZEL) tend to be popular with investors, and for good reason - some research suggests a significant amount of all stock market returns come from reinvested dividends. Unfortunately, it's common for investors to be enticed in by the seemingly attractive yield, and lose money when the company has to cut its dividend payments.
With a goodly-sized dividend yield despite a relatively short payment history, investors might be wondering if Z Energy is a new dividend aristocrat in the making. We'd agree the yield does look enticing. When buying stocks for their dividends, you should always run through the checks below, to see if the dividend looks sustainable.
Explore this interactive chart for our latest analysis on Z Energy!
Payout ratios
Dividends are usually paid out of company earnings. If a company is paying more than it earns, then the dividend might become unsustainable - hardly an ideal situation. As a result, we should always investigate whether a company can afford its dividend, measured as a percentage of a company's net income after tax. In the last year, Z Energy paid out 100% of its profit as dividends. Its payout ratio is quite high, and the dividend is not well covered by earnings. If earnings are growing or the company has a large cash balance, this might be sustainable - still, we think it is a concern.
Another important check we do is to see if the free cash flow generated is sufficient to pay the dividend. With a cash payout ratio of 491%, Z Energy's dividend payments are poorly covered by cash flow. Paying out more than 100% of your free cash flow in dividends is generally not a long-term, sustainable state of affairs, so we think shareholders should watch this metric closely. Cash is slightly more important than profit from a dividend perspective, but given Z Energy's payments were not well covered by either earnings or cash flow, we are concerned about the sustainability of this dividend.
Is Z Energy's Balance Sheet Risky?
As Z Energy's dividend was not well covered by earnings, we need to check its balance sheet for signs of financial distress. A rough way to check this is with these two simple ratios: a) net debt divided by EBITDA (earnings before interest, tax, depreciation and amortisation), and b) net interest cover. Net debt to EBITDA measures total debt load relative to company earnings (lower = less debt), while net interest cover measures the ability to pay interest on the debt (higher = greater ability to pay interest costs). With net debt of 3.20 times its EBITDA, investors are starting to take on a meaningful amount of risk, should the business enter a downturn.
We calculated its interest cover by measuring its earnings before interest and tax (EBIT), and dividing this by the company's net interest expense. Interest cover of 3.85 times its interest expense is starting to become a concern for Z Energy, and be aware that lenders may place additional restrictions on the company as well.
Remember, you can always get a snapshot of Z Energy's latest financial position, by checking our visualisation of its financial health.
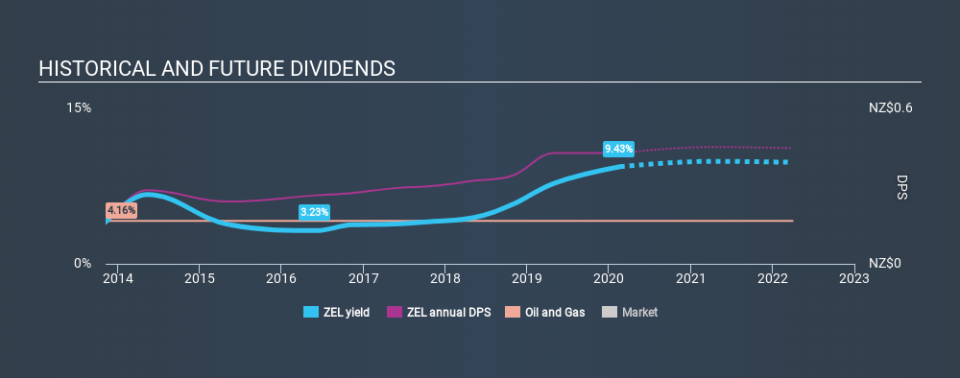
Dividend Volatility
From the perspective of an income investor who wants to earn dividends for many years, there is not much point buying a stock if its dividend is regularly cut or is not reliable. Looking at the data, we can see that Z Energy has been paying a dividend for the past six years. The dividend has been quite stable over the past six years, which is great to see - although we usually like to see the dividend maintained for a decade before giving it full marks, though. During the past six-year period, the first annual payment was NZ$0.15 in 2014, compared to NZ$0.43 last year. Dividends per share have grown at approximately 19% per year over this time.
We're not overly excited about the relatively short history of dividend payments, however the dividend is growing at a nice rate and we might take a closer look.
Dividend Growth Potential
While dividend payments have been relatively reliable, it would also be nice if earnings per share (EPS) were growing, as this is essential to maintaining the dividend's purchasing power over the long term. Earnings have grown at around 3.8% a year for the past five years, which is better than seeing them shrink! Still, the company has struggled to grow its EPS, and currently pays out 100% of its earnings. As they say in finance, 'past performance is not indicative of future performance', but we are not confident a company with limited earnings growth and a high payout ratio will be a star dividend-payer over the next decade.
Conclusion
Dividend investors should always want to know if a) a company's dividends are affordable, b) if there is a track record of consistent payments, and c) if the dividend is capable of growing. It's a concern to see that the company paid out such a high percentage of its earnings and cashflow as dividends. Unfortunately, earnings growth has also been mediocre, and we think it has not been paying dividends long enough to demonstrate resilience across economic cycles. Using these criteria, Z Energy looks quite suboptimal from a dividend investment perspective.
Companies that are growing earnings tend to be the best dividend stocks over the long term. See what the 6 analysts we track are forecasting for Z Energy for free with public analyst estimates for the company.
If you are a dividend investor, you might also want to look at our curated list of dividend stocks yielding above 3%.
If you spot an error that warrants correction, please contact the editor at editorial-team@simplywallst.com. This article by Simply Wall St is general in nature. It does not constitute a recommendation to buy or sell any stock, and does not take account of your objectives, or your financial situation. Simply Wall St has no position in the stocks mentioned.
We aim to bring you long-term focused research analysis driven by fundamental data. Note that our analysis may not factor in the latest price-sensitive company announcements or qualitative material. Thank you for reading.
