
 Yahoo Finance
 Is Brooks Automation's (NASDAQ:BRKS) 192% Share Price Increase Well Justified?

Want to participate in a research study? Help shape the future of investing tools and earn a $60 gift card!
The worst result, after buying shares in a company (assuming no leverage), would be if you lose all the money you put in. But in contrast you can make much more than 100% if the company does well. To wit, the Brooks Automation, Inc. (NASDAQ:BRKS) share price has flown 192% in the last three years. That sort of return is as solid as granite. Also pleasing for shareholders was the 13% gain in the last three months. But this move may well have been assisted by the reasonably buoyant market (up 16% in 90 days).
View our latest analysis for Brooks Automation
To paraphrase Benjamin Graham: Over the short term the market is a voting machine, but over the long term it's a weighing machine. One imperfect but simple way to consider how the market perception of a company has shifted is to compare the change in the earnings per share (EPS) with the share price movement.
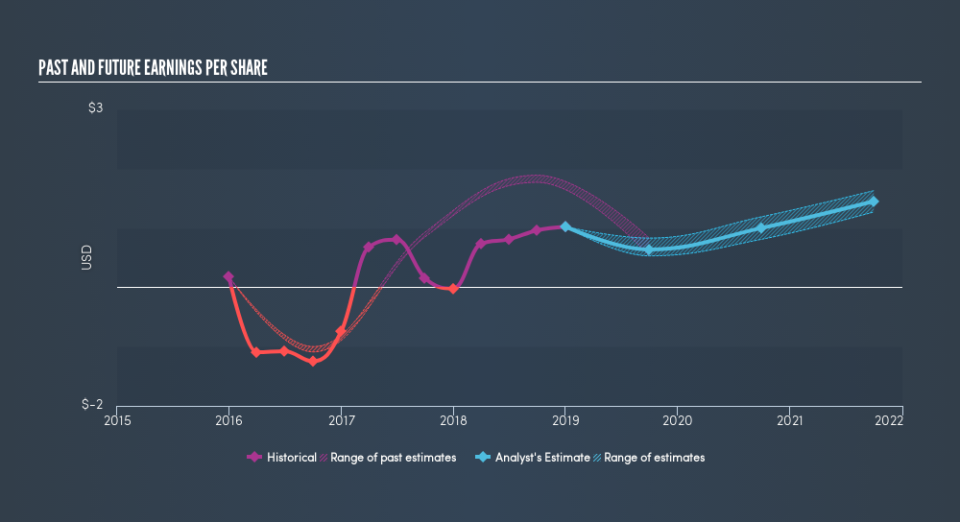
Brooks Automation became profitable within the last three years. Given the importance of this milestone, it's not overly surprising that the share price has increased strongly.
You can see how EPS has changed over time in the image below (click on the chart to see the exact values).
We know that Brooks Automation has improved its bottom line over the last three years, but what does the future have in store? If you are thinking of buying or selling Brooks Automation stock, you should check out this FREE detailed report on its balance sheet.
What About Dividends?
As well as measuring the share price return, investors should also consider the total shareholder return (TSR). The TSR incorporates the value of any spin-offs or discounted capital raisings, along with any dividends, based on the assumption that the dividends are reinvested. So for companies that pay a generous dividend, the TSR is often a lot higher than the share price return. We note that for Brooks Automation the TSR over the last 3 years was 208%, which is better than the share price return mentioned above. The dividends paid by the company have thusly boosted the total shareholder return.
A Different Perspective
We're pleased to report that Brooks Automation shareholders have received a total shareholder return of 14% over one year. Of course, that includes the dividend. Having said that, the five-year TSR of 25% a year, is even better. Potential buyers might understandably feel they've missed the opportunity, but it's always possible business is still firing on all cylinders. Before spending more time on Brooks Automation it might be wise to click here to see if insiders have been buying or selling shares.
Of course Brooks Automation may not be the best stock to buy. So you may wish to see this free collection of growth stocks.
Please note, the market returns quoted in this article reflect the market weighted average returns of stocks that currently trade on US exchanges.
We aim to bring you long-term focused research analysis driven by fundamental data. Note that our analysis may not factor in the latest price-sensitive company announcements or qualitative material.
If you spot an error that warrants correction, please contact the editor at editorial-team@simplywallst.com. This article by Simply Wall St is general in nature. It does not constitute a recommendation to buy or sell any stock, and does not take account of your objectives, or your financial situation. Simply Wall St has no position in the stocks mentioned. Thank you for reading.
