
 Yahoo Finance
 Is Brookline Bancorp, Inc. (NASDAQ:BRKL) Over-Exposed To Risk?

Improving credit quality as a result of post-GFC recovery has led to a strong environment for growth in the banking sector. As a small-cap bank with a market capitalisation of US$1.2b, Brookline Bancorp, Inc.’s (NASDAQ:BRKL) profit and value are directly affected by economic growth. This is because borrowers’ demand for, and ability to repay, their loans depend on the stability of their salaries and interest rates. Risk associated with repayment is measured by bad debt which is written off as an expense, impacting Brookline Bancorp’s bottom line. Today I will take you through some bad debt and liability measures to analyse the level of risky assets held by the bank. Looking through a risk-lens is a useful way to assess the attractiveness of Brookline Bancorp’s a stock investment.
View our latest analysis for Brookline Bancorp
Want to participate in a short research study? Help shape the future of investing tools and receive a $60 prize!
How Good Is Brookline Bancorp At Forecasting Its Risks?
The ability for Brookline Bancorp to accurately forecast and provision for its bad loans shows it has a strong understanding of the level of risk it is taking on. If the bank provision covers more than 100% of what it actually writes off, then it is considered sensible and relatively accurate in its provisioning of bad debt. Given its large bad loan to bad debt ratio of 232.69%, Brookline Bancorp excessively over-provisioned by 132.69% above the appropriate minimum, indicating the bank may perhaps be too cautious with their expectation of bad debt.
How Much Risk Is Too Much?
Brookline Bancorp is considered to be in a good financial shape if it does not engage in overly risky lending practices. So what constitutes as overly risky? Total loans should generally be made up of less than 3% of loans that are considered unrecoverable, also known as bad debt. When these loans are not repaid, they are written off as expenses which comes directly out of the bank’s profit. Since bad loans only make up a very insignificant 0.41% of its total assets, the bank exhibits very strict bad loan management and is exposed to a relatively insignificant level of risk in terms of default.
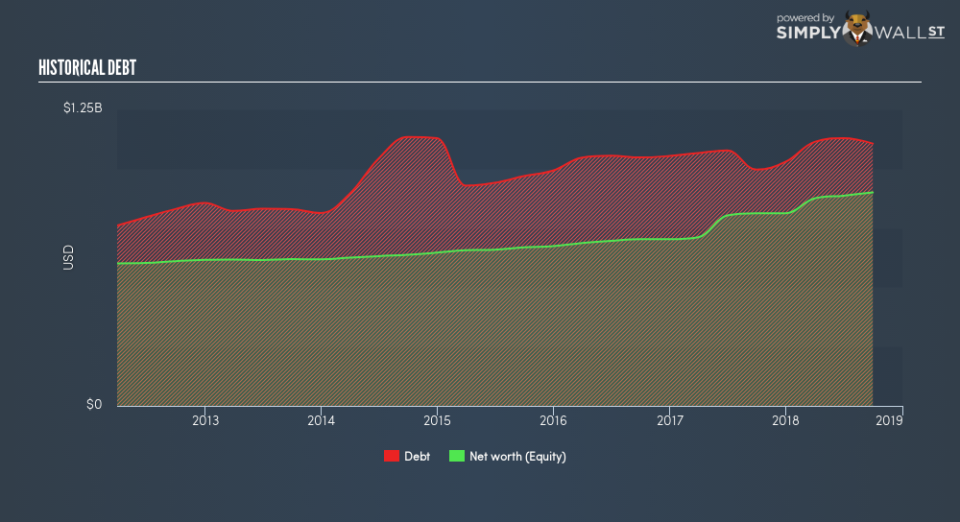
How Big Is Brookline Bancorp’s Safety Net?

Brookline Bancorp makes money by lending out its various forms of borrowings. Deposits from customers tend to bear the lowest risk given the relatively stable amount available and interest rate. Generally, the higher level of deposits a bank retains, the less risky it is deemed to be. Since Brookline Bancorp’s total deposit to total liabilities is very high at 82% which is well-above the prudent level of 50% for banks, Brookline Bancorp may be too cautious with its level of deposits and has plenty of headroom to take on risker forms of liability.
Next Steps:
BRKL’s acquisition will impact the business moving forward. Keep an eye on how this decision plays out in the future, especially on its financial health and earnings growth. Below, I’ve listed three fundamental areas on Simply Wall St’s dashboard for a quick visualization on current trends for BRKL. I’ve also used this site as a source of data for my article.
Future Outlook: What are well-informed industry analysts predicting for BRKL’s future growth? Take a look at our free research report of analyst consensus for BRKL’s outlook.
Valuation: What is BRKL worth today? Has the future growth potential already been factored into the price? The intrinsic value infographic in our free research report helps visualize whether BRKL is currently mispriced by the market.
Other High-Performing Stocks: Are there other stocks that provide better prospects with proven track records? Explore our free list of these great stocks here.
To help readers see past the short term volatility of the financial market, we aim to bring you a long-term focused research analysis purely driven by fundamental data. Note that our analysis does not factor in the latest price-sensitive company announcements.
The author is an independent contributor and at the time of publication had no position in the stocks mentioned. For errors that warrant correction please contact the editor at editorial-team@simplywallst.com.
