
 Yahoo Finance
 Is Broo (ASX:BEE) Using Too Much Debt?

Legendary fund manager Li Lu (who Charlie Munger backed) once said, 'The biggest investment risk is not the volatility of prices, but whether you will suffer a permanent loss of capital. It's only natural to consider a company's balance sheet when you examine how risky it is, since debt is often involved when a business collapses. We can see that Broo Limited (ASX:BEE) does use debt in its business. But should shareholders be worried about its use of debt?
When Is Debt Dangerous?
Debt is a tool to help businesses grow, but if a business is incapable of paying off its lenders, then it exists at their mercy. If things get really bad, the lenders can take control of the business. However, a more common (but still painful) scenario is that it has to raise new equity capital at a low price, thus permanently diluting shareholders. By replacing dilution, though, debt can be an extremely good tool for businesses that need capital to invest in growth at high rates of return. The first thing to do when considering how much debt a business uses is to look at its cash and debt together.
View our latest analysis for Broo
How Much Debt Does Broo Carry?
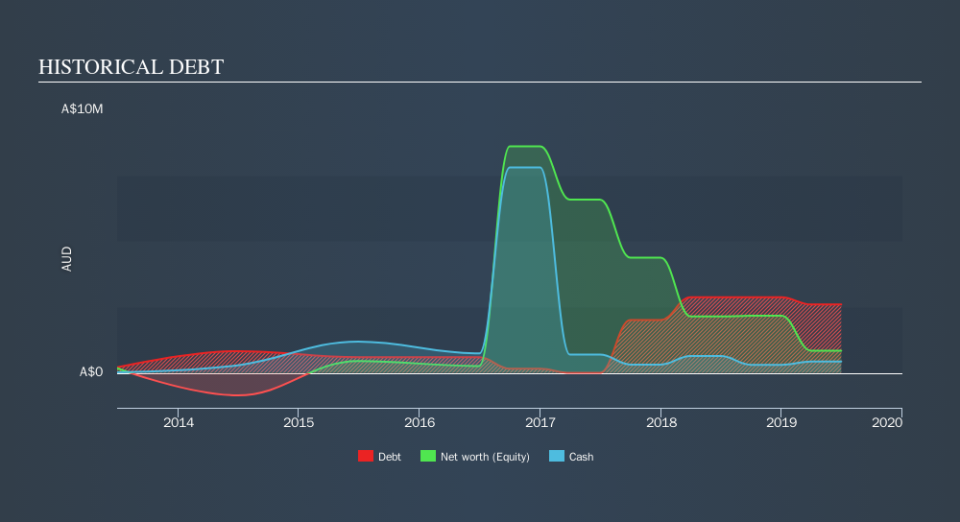
The image below, which you can click on for greater detail, shows that Broo had debt of AU$2.60m at the end of June 2019, a reduction from AU$3.02m over a year. However, it does have AU$426.8k in cash offsetting this, leading to net debt of about AU$2.17m.
A Look At Broo's Liabilities
According to the last reported balance sheet, Broo had liabilities of AU$4.13m due within 12 months, and liabilities of AU$1.24m due beyond 12 months. On the other hand, it had cash of AU$426.8k and AU$238.7k worth of receivables due within a year. So its liabilities outweigh the sum of its cash and (near-term) receivables by AU$4.71m.
This deficit isn't so bad because Broo is worth AU$10.3m, and thus could probably raise enough capital to shore up its balance sheet, if the need arose. However, it is still worthwhile taking a close look at its ability to pay off debt. When analysing debt levels, the balance sheet is the obvious place to start. But it is Broo's earnings that will influence how the balance sheet holds up in the future. So when considering debt, it's definitely worth looking at the earnings trend. Click here for an interactive snapshot.
Over 12 months, Broo reported revenue of AU$3.7m, which is a gain of 43%, although it did not report any earnings before interest and tax. With any luck the company will be able to grow its way to profitability.
Caveat Emptor
While we can certainly savour Broo's tasty revenue growth, its negative earnings before interest and tax (EBIT) leaves a bitter aftertaste. Indeed, it lost a very considerable AU$3.0m at the EBIT level. Considering that alongside the liabilities mentioned above does not give us much confidence that company should be using so much debt. Quite frankly we think the balance sheet is far from match-fit, although it could be improved with time. Another cause for caution is that is bled AU$1.6m in negative free cash flow over the last twelve months. So in short it's a really risky stock. When we look at a riskier company, we like to check how their profits (or losses) are trending over time. Today, we're providing readers this interactive graph showing how Broo's profit, revenue, and operating cashflow have changed over the last few years.
Of course, if you're the type of investor who prefers buying stocks without the burden of debt, then don't hesitate to discover our exclusive list of net cash growth stocks, today.
We aim to bring you long-term focused research analysis driven by fundamental data. Note that our analysis may not factor in the latest price-sensitive company announcements or qualitative material.
If you spot an error that warrants correction, please contact the editor at editorial-team@simplywallst.com. This article by Simply Wall St is general in nature. It does not constitute a recommendation to buy or sell any stock, and does not take account of your objectives, or your financial situation. Simply Wall St has no position in the stocks mentioned. Thank you for reading.
