
 Yahoo Finance
 How Has Brambles Limited’s (ASX:BXB) Performed Against The Industry?

For investors, increase in profitability and industry-beating performance can be essential considerations in an investment. Below, I will examine Brambles Limited’s (ASX:BXB) track record on a high level, to give you some insight into how the company has been performing against its long term trend and its industry peers.
View our latest analysis for Brambles
Commentary On BXB’s Past Performance
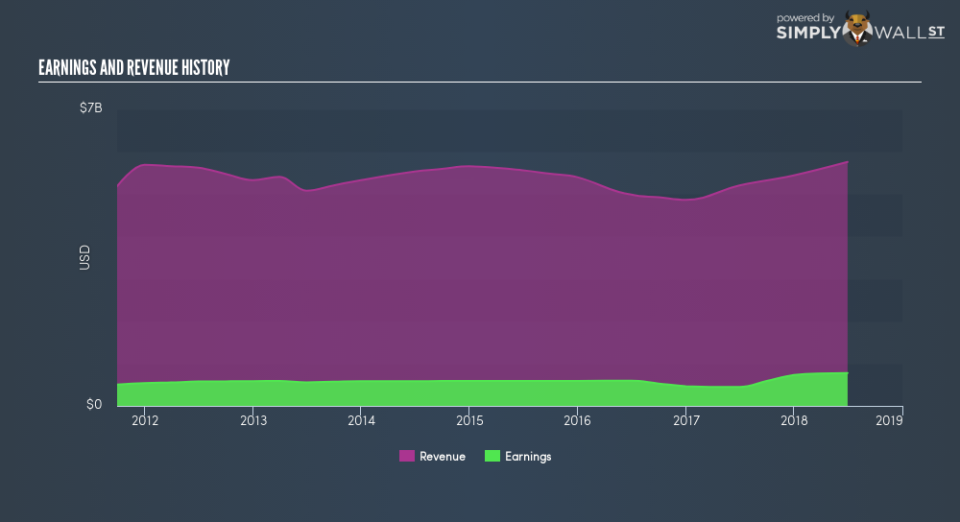
BXB’s trailing twelve-month earnings (from 30 June 2018) of US$773.5m has jumped 73.9% compared to the previous year. Furthermore, this one-year growth rate has exceeded its 5-year annual growth average of 1.8%, indicating the rate at which BXB is growing has accelerated. How has it been able to do this? Let’s see whether it is merely attributable to industry tailwinds, or if Brambles has experienced some company-specific growth.
Over the past few years, Brambles expanded bottom-line, while its top-line declined, by effectively controlling its costs. This has caused to a margin expansion and profitability over time. Looking at growth from a sector-level, the Australian commercial services industry has been growing its average earnings by double-digit 46.7% in the previous twelve months, and a more subdued 8.3% over the previous five years. This growth is a median of profitable companies of 13 Commercial Services companies in AU including Downer EDI, Wellcom Group and SG Fleet Group. This means that any uplift the industry is deriving benefit from, Brambles is able to leverage this to its advantage.
In terms of returns from investment, Brambles has invested its equity funds well leading to a 24.5% return on equity (ROE), above the sensible minimum of 20%. Furthermore, its return on assets (ROA) of 11.3% exceeds the AU Commercial Services industry of 7.9%, indicating Brambles has used its assets more efficiently. And finally, its return on capital (ROC), which also accounts for Brambles’s debt level, has increased over the past 3 years from 15.3% to 16.5%. This correlates with a decrease in debt holding, with debt-to-equity ratio declining from 94.2% to 78.7% over the past 5 years.
What does this mean?
While past data is useful, it doesn’t tell the whole story. Positive growth and profitability are what investors like to see in a company’s track record, but how do we properly assess sustainability? I suggest you continue to research Brambles to get a more holistic view of the stock by looking at:
Future Outlook: What are well-informed industry analysts predicting for BXB’s future growth? Take a look at our free research report of analyst consensus for BXB’s outlook.
Financial Health: Are BXB’s operations financially sustainable? Balance sheets can be hard to analyze, which is why we’ve done it for you. Check out our financial health checks here.
Other High-Performing Stocks: Are there other stocks that provide better prospects with proven track records? Explore our free list of these great stocks here.
NB: Figures in this article are calculated using data from the trailing twelve months from 30 June 2018. This may not be consistent with full year annual report figures.
To help readers see past the short term volatility of the financial market, we aim to bring you a long-term focused research analysis purely driven by fundamental data. Note that our analysis does not factor in the latest price-sensitive company announcements.
The author is an independent contributor and at the time of publication had no position in the stocks mentioned. For errors that warrant correction please contact the editor at editorial-team@simplywallst.com.
