
 Yahoo Finance
 Brüder Mannesmann (FRA:BMM) Could Be Struggling To Allocate Capital
Did you know there are some financial metrics that can provide clues of a potential multi-bagger? Ideally, a business will show two trends; firstly a growing return on capital employed (ROCE) and secondly, an increasing amount of capital employed. Ultimately, this demonstrates that it's a business that is reinvesting profits at increasing rates of return. In light of that, when we looked at Brüder Mannesmann (FRA:BMM) and its ROCE trend, we weren't exactly thrilled.
Return On Capital Employed (ROCE): What Is It?
If you haven't worked with ROCE before, it measures the 'return' (pre-tax profit) a company generates from capital employed in its business. Analysts use this formula to calculate it for Brüder Mannesmann:
Return on Capital Employed = Earnings Before Interest and Tax (EBIT) ÷ (Total Assets - Current Liabilities)
0.0065 = €206k ÷ (€41m - €9.6m) (Based on the trailing twelve months to December 2022).
Thus, Brüder Mannesmann has an ROCE of 0.6%. Ultimately, that's a low return and it under-performs the Retail Distributors industry average of 13%.
Check out our latest analysis for Brüder Mannesmann
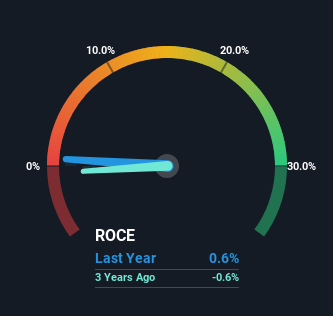
Historical performance is a great place to start when researching a stock so above you can see the gauge for Brüder Mannesmann's ROCE against it's prior returns. If you want to delve into the historical earnings, revenue and cash flow of Brüder Mannesmann, check out these free graphs here.
The Trend Of ROCE
When we looked at the ROCE trend at Brüder Mannesmann, we didn't gain much confidence. Over the last five years, returns on capital have decreased to 0.6% from 8.0% five years ago. And considering revenue has dropped while employing more capital, we'd be cautious. This could mean that the business is losing its competitive advantage or market share, because while more money is being put into ventures, it's actually producing a lower return - "less bang for their buck" per se.
On a related note, Brüder Mannesmann has decreased its current liabilities to 23% of total assets. So we could link some of this to the decrease in ROCE. What's more, this can reduce some aspects of risk to the business because now the company's suppliers or short-term creditors are funding less of its operations. Some would claim this reduces the business' efficiency at generating ROCE since it is now funding more of the operations with its own money.
The Bottom Line On Brüder Mannesmann's ROCE
From the above analysis, we find it rather worrisome that returns on capital and sales for Brüder Mannesmann have fallen, meanwhile the business is employing more capital than it was five years ago. In spite of that, the stock has delivered a 39% return to shareholders who held over the last five years. Regardless, we don't like the trends as they are and if they persist, we think you might find better investments elsewhere.
On a final note, we found 5 warning signs for Brüder Mannesmann (4 shouldn't be ignored) you should be aware of.
While Brüder Mannesmann isn't earning the highest return, check out this free list of companies that are earning high returns on equity with solid balance sheets.
Have feedback on this article? Concerned about the content? Get in touch with us directly. Alternatively, email editorial-team (at) simplywallst.com.
This article by Simply Wall St is general in nature. We provide commentary based on historical data and analyst forecasts only using an unbiased methodology and our articles are not intended to be financial advice. It does not constitute a recommendation to buy or sell any stock, and does not take account of your objectives, or your financial situation. We aim to bring you long-term focused analysis driven by fundamental data. Note that our analysis may not factor in the latest price-sensitive company announcements or qualitative material. Simply Wall St has no position in any stocks mentioned.
