
 Yahoo Finance
 Boston Beer Company's (NYSE:SAM) investors will be pleased with their favorable 69% return over the last five years
When we invest, we're generally looking for stocks that outperform the market average. And the truth is, you can make significant gains if you buy good quality businesses at the right price. To wit, the Boston Beer Company share price has climbed 69% in five years, easily topping the market return of 50% (ignoring dividends).
With that in mind, it's worth seeing if the company's underlying fundamentals have been the driver of long term performance, or if there are some discrepancies.
Check out our latest analysis for Boston Beer Company
There is no denying that markets are sometimes efficient, but prices do not always reflect underlying business performance. By comparing earnings per share (EPS) and share price changes over time, we can get a feel for how investor attitudes to a company have morphed over time.
During five years of share price growth, Boston Beer Company actually saw its EPS drop 7.6% per year.
Essentially, it doesn't seem likely that investors are focused on EPS. Because earnings per share don't seem to match up with the share price, we'll take a look at other metrics instead.
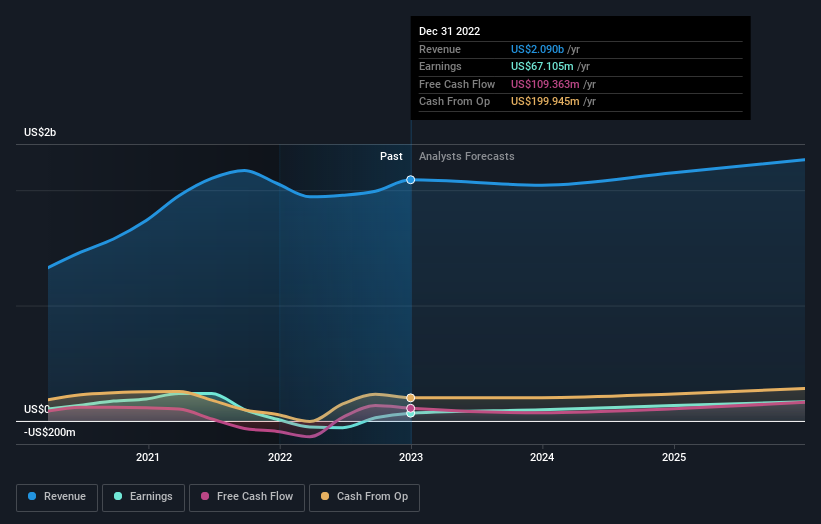
On the other hand, Boston Beer Company's revenue is growing nicely, at a compound rate of 20% over the last five years. It's quite possible that management are prioritizing revenue growth over EPS growth at the moment.
You can see below how earnings and revenue have changed over time (discover the exact values by clicking on the image).
Boston Beer Company is well known by investors, and plenty of clever analysts have tried to predict the future profit levels. So it makes a lot of sense to check out what analysts think Boston Beer Company will earn in the future (free analyst consensus estimates)
A Different Perspective
We regret to report that Boston Beer Company shareholders are down 18% for the year. Unfortunately, that's worse than the broader market decline of 10%. Having said that, it's inevitable that some stocks will be oversold in a falling market. The key is to keep your eyes on the fundamental developments. On the bright side, long term shareholders have made money, with a gain of 11% per year over half a decade. It could be that the recent sell-off is an opportunity, so it may be worth checking the fundamental data for signs of a long term growth trend. I find it very interesting to look at share price over the long term as a proxy for business performance. But to truly gain insight, we need to consider other information, too. Even so, be aware that Boston Beer Company is showing 2 warning signs in our investment analysis , you should know about...
If you are like me, then you will not want to miss this free list of growing companies that insiders are buying.
Please note, the market returns quoted in this article reflect the market weighted average returns of stocks that currently trade on American exchanges.
Have feedback on this article? Concerned about the content? Get in touch with us directly. Alternatively, email editorial-team (at) simplywallst.com.
This article by Simply Wall St is general in nature. We provide commentary based on historical data and analyst forecasts only using an unbiased methodology and our articles are not intended to be financial advice. It does not constitute a recommendation to buy or sell any stock, and does not take account of your objectives, or your financial situation. We aim to bring you long-term focused analysis driven by fundamental data. Note that our analysis may not factor in the latest price-sensitive company announcements or qualitative material. Simply Wall St has no position in any stocks mentioned.
Join A Paid User Research Session
You’ll receive a US$30 Amazon Gift card for 1 hour of your time while helping us build better investing tools for the individual investors like yourself. Sign up here
