
 Yahoo Finance
 Boom Logistics (ASX:BOL) Might Have The Makings Of A Multi-Bagger
What trends should we look for it we want to identify stocks that can multiply in value over the long term? Typically, we'll want to notice a trend of growing return on capital employed (ROCE) and alongside that, an expanding base of capital employed. Basically this means that a company has profitable initiatives that it can continue to reinvest in, which is a trait of a compounding machine. So when we looked at Boom Logistics (ASX:BOL) and its trend of ROCE, we really liked what we saw.
Understanding Return On Capital Employed (ROCE)
For those who don't know, ROCE is a measure of a company's yearly pre-tax profit (its return), relative to the capital employed in the business. To calculate this metric for Boom Logistics, this is the formula:
Return on Capital Employed = Earnings Before Interest and Tax (EBIT) ÷ (Total Assets - Current Liabilities)
0.039 = AU$5.0m ÷ (AU$207m - AU$78m) (Based on the trailing twelve months to June 2023).
Therefore, Boom Logistics has an ROCE of 3.9%. Ultimately, that's a low return and it under-performs the Trade Distributors industry average of 11%.
View our latest analysis for Boom Logistics
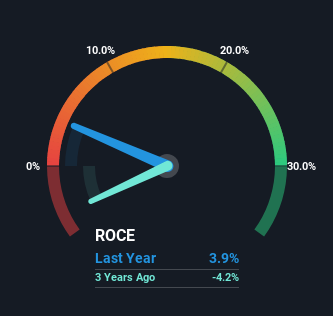
Historical performance is a great place to start when researching a stock so above you can see the gauge for Boom Logistics' ROCE against it's prior returns. If you'd like to look at how Boom Logistics has performed in the past in other metrics, you can view this free graph of past earnings, revenue and cash flow.
The Trend Of ROCE
While the ROCE is still rather low for Boom Logistics, we're glad to see it heading in the right direction. The data shows that returns on capital have increased by 166% over the trailing five years. The company is now earning AU$0.04 per dollar of capital employed. Speaking of capital employed, the company is actually utilizing 29% less than it was five years ago, which can be indicative of a business that's improving its efficiency. Boom Logistics may be selling some assets so it's worth investigating if the business has plans for future investments to increase returns further still.
On a side note, we noticed that the improvement in ROCE appears to be partly fueled by an increase in current liabilities. Effectively this means that suppliers or short-term creditors are now funding 38% of the business, which is more than it was five years ago. It's worth keeping an eye on this because as the percentage of current liabilities to total assets increases, some aspects of risk also increase.
The Bottom Line
In summary, it's great to see that Boom Logistics has been able to turn things around and earn higher returns on lower amounts of capital. Given the stock has declined 34% in the last five years, this could be a good investment if the valuation and other metrics are also appealing. That being the case, research into the company's current valuation metrics and future prospects seems fitting.
On a final note, we've found 1 warning sign for Boom Logistics that we think you should be aware of.
While Boom Logistics isn't earning the highest return, check out this free list of companies that are earning high returns on equity with solid balance sheets.
Have feedback on this article? Concerned about the content? Get in touch with us directly. Alternatively, email editorial-team (at) simplywallst.com.
This article by Simply Wall St is general in nature. We provide commentary based on historical data and analyst forecasts only using an unbiased methodology and our articles are not intended to be financial advice. It does not constitute a recommendation to buy or sell any stock, and does not take account of your objectives, or your financial situation. We aim to bring you long-term focused analysis driven by fundamental data. Note that our analysis may not factor in the latest price-sensitive company announcements or qualitative material. Simply Wall St has no position in any stocks mentioned.
