
 Yahoo Finance
 Boart Longyear Group (ASX:BLY) Is Experiencing Growth In Returns On Capital
What trends should we look for it we want to identify stocks that can multiply in value over the long term? Typically, we'll want to notice a trend of growing return on capital employed (ROCE) and alongside that, an expanding base of capital employed. Ultimately, this demonstrates that it's a business that is reinvesting profits at increasing rates of return. Speaking of which, we noticed some great changes in Boart Longyear Group's (ASX:BLY) returns on capital, so let's have a look.
What Is Return On Capital Employed (ROCE)?
If you haven't worked with ROCE before, it measures the 'return' (pre-tax profit) a company generates from capital employed in its business. Analysts use this formula to calculate it for Boart Longyear Group:
Return on Capital Employed = Earnings Before Interest and Tax (EBIT) ÷ (Total Assets - Current Liabilities)
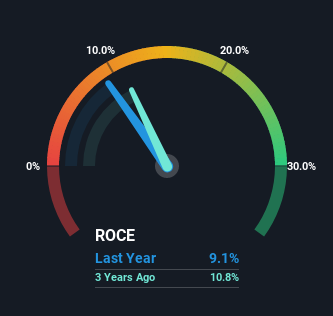
0.091 = US$51m ÷ (US$775m - US$219m) (Based on the trailing twelve months to December 2022).
Therefore, Boart Longyear Group has an ROCE of 9.1%. In absolute terms, that's a low return but it's around the Metals and Mining industry average of 11%.
Check out our latest analysis for Boart Longyear Group
While the past is not representative of the future, it can be helpful to know how a company has performed historically, which is why we have this chart above. If you'd like to look at how Boart Longyear Group has performed in the past in other metrics, you can view this free graph of past earnings, revenue and cash flow.
What The Trend Of ROCE Can Tell Us
The fact that Boart Longyear Group is now generating some pre-tax profits from its prior investments is very encouraging. The company was generating losses five years ago, but now it's earning 9.1% which is a sight for sore eyes. In addition to that, Boart Longyear Group is employing 34% more capital than previously which is expected of a company that's trying to break into profitability. This can tell us that the company has plenty of reinvestment opportunities that are able to generate higher returns.
One more thing to note, Boart Longyear Group has decreased current liabilities to 28% of total assets over this period, which effectively reduces the amount of funding from suppliers or short-term creditors. So this improvement in ROCE has come from the business' underlying economics, which is great to see.
In Conclusion...
Long story short, we're delighted to see that Boart Longyear Group's reinvestment activities have paid off and the company is now profitable. And since the stock has dived 97% over the last five years, there may be other factors affecting the company's prospects. Still, it's worth doing some further research to see if the trends will continue into the future.
On a separate note, we've found 1 warning sign for Boart Longyear Group you'll probably want to know about.
For those who like to invest in solid companies, check out this free list of companies with solid balance sheets and high returns on equity.
Have feedback on this article? Concerned about the content? Get in touch with us directly. Alternatively, email editorial-team (at) simplywallst.com.
This article by Simply Wall St is general in nature. We provide commentary based on historical data and analyst forecasts only using an unbiased methodology and our articles are not intended to be financial advice. It does not constitute a recommendation to buy or sell any stock, and does not take account of your objectives, or your financial situation. We aim to bring you long-term focused analysis driven by fundamental data. Note that our analysis may not factor in the latest price-sensitive company announcements or qualitative material. Simply Wall St has no position in any stocks mentioned.
Join A Paid User Research Session
You’ll receive a US$30 Amazon Gift card for 1 hour of your time while helping us build better investing tools for the individual investors like yourself. Sign up here
