
 Yahoo Finance
 Update: Blue Bird (NASDAQ:BLBD) Stock Gained 65% In The Last Three Years

Want to participate in a research study? Help shape the future of investing tools and earn a $60 gift card!
Blue Bird Corporation (NASDAQ:BLBD) shareholders might be concerned after seeing the share price drop 12% in the last month. But don’t let that distract from the very nice return generated over three years. In the last three years the share price is up, 65%: better than the market.
See our latest analysis for Blue Bird
To paraphrase Benjamin Graham: Over the short term the market is a voting machine, but over the long term it’s a weighing machine. One way to examine how market sentiment has changed over time is to look at the interaction between a company’s share price and its earnings per share (EPS).
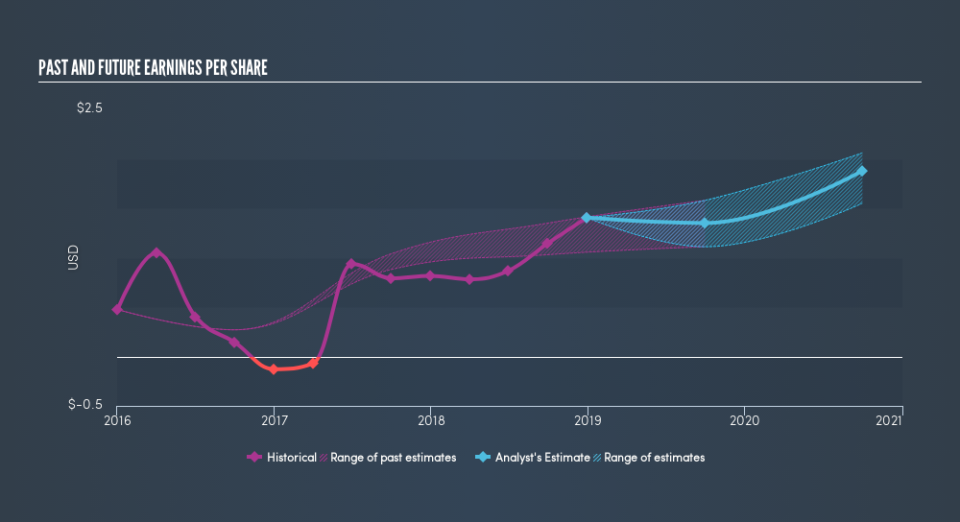
Blue Bird was able to grow its EPS at 44% per year over three years, sending the share price higher. The average annual share price increase of 18% is actually lower than the EPS growth. So one could reasonably conclude that the market has cooled on the stock.
The image below shows how EPS has tracked over time (if you click on the image you can see greater detail).
We know that Blue Bird has improved its bottom line over the last three years, but what does the future have in store? You can see how its balance sheet has strengthened (or weakened) over time in this free interactive graphic.
A Different Perspective
The last twelve months weren’t great for Blue Bird shares, which cost holders 26%, while the market was up about 6.3%. Of course the long term matters more than the short term, and even great stocks will sometimes have a poor year. Fortunately the longer term story is brighter, with total returns averaging about 18% per year over three years. Sometimes when a good quality long term winner has a weak period, it’s turns out to be an opportunity, but you really need to be sure that the quality is there. If you would like to research Blue Bird in more detail then you might want to take a look at whether insiders have been buying or selling shares in the company.
Of course, you might find a fantastic investment by looking elsewhere. So take a peek at this free list of companies we expect will grow earnings.
Please note, the market returns quoted in this article reflect the market weighted average returns of stocks that currently trade on US exchanges.
We aim to bring you long-term focused research analysis driven by fundamental data. Note that our analysis may not factor in the latest price-sensitive company announcements or qualitative material.
If you spot an error that warrants correction, please contact the editor at editorial-team@simplywallst.com. This article by Simply Wall St is general in nature. It does not constitute a recommendation to buy or sell any stock, and does not take account of your objectives, or your financial situation. Simply Wall St has no position in the stocks mentioned. Thank you for reading.
