
 Yahoo Finance
 Biglari Holdings (NYSE:BH.A) Shareholders Will Want The ROCE Trajectory To Continue
If we want to find a potential multi-bagger, often there are underlying trends that can provide clues. Ideally, a business will show two trends; firstly a growing return on capital employed (ROCE) and secondly, an increasing amount of capital employed. This shows us that it's a compounding machine, able to continually reinvest its earnings back into the business and generate higher returns. With that in mind, we've noticed some promising trends at Biglari Holdings (NYSE:BH.A) so let's look a bit deeper.
Understanding Return On Capital Employed (ROCE)
Just to clarify if you're unsure, ROCE is a metric for evaluating how much pre-tax income (in percentage terms) a company earns on the capital invested in its business. The formula for this calculation on Biglari Holdings is:
Return on Capital Employed = Earnings Before Interest and Tax (EBIT) ÷ (Total Assets - Current Liabilities)
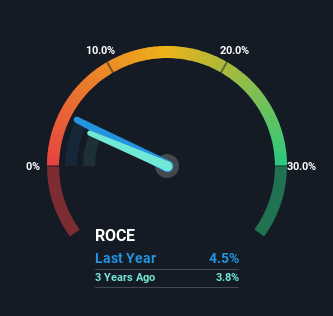
0.045 = US$35m ÷ (US$885m - US$118m) (Based on the trailing twelve months to March 2024).
So, Biglari Holdings has an ROCE of 4.5%. Ultimately, that's a low return and it under-performs the Hospitality industry average of 10%.
Check out our latest analysis for Biglari Holdings
While the past is not representative of the future, it can be helpful to know how a company has performed historically, which is why we have this chart above. If you want to delve into the historical earnings , check out these free graphs detailing revenue and cash flow performance of Biglari Holdings.
So How Is Biglari Holdings' ROCE Trending?
Like most people, we're pleased that Biglari Holdings is now generating some pretax earnings. Historically the company was generating losses but as we can see from the latest figures referenced above, they're now earning 4.5% on their capital employed. At first glance, it seems the business is getting more proficient at generating returns, because over the same period, the amount of capital employed has reduced by 22%. Biglari Holdings could be selling under-performing assets since the ROCE is improving.
What We Can Learn From Biglari Holdings' ROCE
From what we've seen above, Biglari Holdings has managed to increase it's returns on capital all the while reducing it's capital base. Since the stock has returned a solid 59% to shareholders over the last five years, it's fair to say investors are beginning to recognize these changes. With that being said, we still think the promising fundamentals mean the company deserves some further due diligence.
One more thing, we've spotted 2 warning signs facing Biglari Holdings that you might find interesting.
While Biglari Holdings isn't earning the highest return, check out this free list of companies that are earning high returns on equity with solid balance sheets.
Have feedback on this article? Concerned about the content? Get in touch with us directly. Alternatively, email editorial-team (at) simplywallst.com.
This article by Simply Wall St is general in nature. We provide commentary based on historical data and analyst forecasts only using an unbiased methodology and our articles are not intended to be financial advice. It does not constitute a recommendation to buy or sell any stock, and does not take account of your objectives, or your financial situation. We aim to bring you long-term focused analysis driven by fundamental data. Note that our analysis may not factor in the latest price-sensitive company announcements or qualitative material. Simply Wall St has no position in any stocks mentioned.
