
 Yahoo Finance
 The biggest risk investors will face for the rest of the year

Australia’s stock market fortunes follow the US. So you absolutely need to keep your eyes on that market. The good news is that the US economy remains strong. It’s the most resilient developed economy in the world.
But it simply cannot avoid the business cycle. And the evidence suggests the business cycle is turning down. When the cycle turns, company earnings take a hit.
Only three things matter for stocks: they are interest rates, company earnings and investor sentiment.
In the age of the central banker, interest rates will always be supportive. That helps keep investor sentiment positive too.
But company earnings have a larger overall impact. If company earnings turn down, sentiment can take a BIG hit.
Which is why the next few weeks are very important. From the Wall Street Journal:
‘The outlook for third-quarter corporate profits is darkening, a threat to further derail a stock market that is already off to the worst start to a quarter since 2016.
‘A flurry of earnings reports in coming weeks will mark the latest test for stocks after a rocky stretch of economic data exacerbated worries that a global manufacturing slowdown is trickling into the U.S.
‘Analysts expect earnings for companies in the S&P 500 to fall about 4% for the third quarter, according to FactSet data, in what would mark the biggest year-over-year drop since 2016. In recent months, Wall Street analysts have lowered their earnings expectations for all 11 sectors in the S&P 500, from energy to technology.’
The accompanying chart shows company earnings growth over the past few years. The Trump tax cuts and a booming economy saw earnings surge in 2017 and 2018. But growth has now stalled. In fact, earnings are expected to decline 4.1% this quarter.
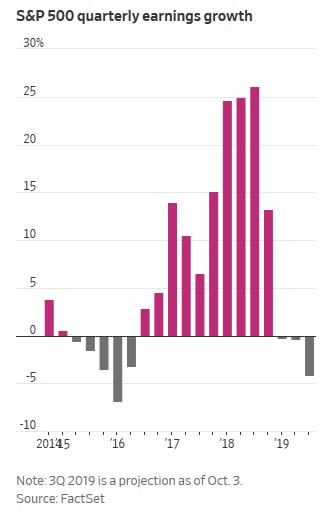
The good news is that this is already priced in. That is, the market already expects poor third quarter earnings. It’s not ‘new’ news.
But if the current slowdown hurts earnings more than expected, then shares could take another hit.
The other big risk facing investors relates to next year. And the year after. According to Yardeni Research, S&P 500 earnings are expected to rise 11.2% in FY20 and 9.5% in FY21.
That is, 2019 earnings are as bad as it gets. That’s the hope anyway. But if the current slowdown drags on, expect to see future earnings downgrades as well. That will have a major negative impact on the market.
Is the S&P 500 giving you any hint that bad news is on the way?
Let’s take a look at the chart…
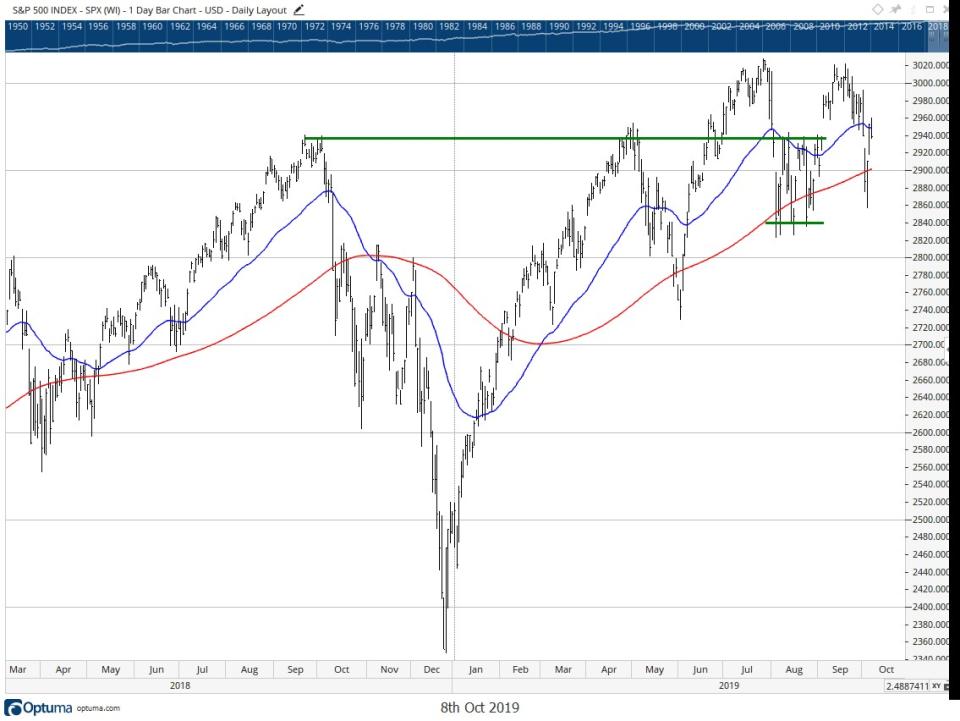
The short answer is no. On the surface, the S&P 500 continues to look good. That is, it is still trending higher. Also, sell-offs have been short lived. So far in 2019, each sell-off found support at a higher level.
But the last rally failed to make a new high. This could be a sign of consolidation and sideways movement for a while. Or, it may be the start of a topping out process. While everyone has an opinion, no one knows how it will play out.
The best I can say is that if the index falls below the August low at 2,840 points (small green line), it will increase the odds that the market is topping out here. Until that happens, the S&P 500 remains in a bullish structure.
What about the local market?
It’s a similar picture. Below is a chart of the ASX 200 index. Like the S&P 500, it’s still trending higher. It’s also interesting to note that in both recent sell-offs, the index found support at the 100-day moving average (red line):
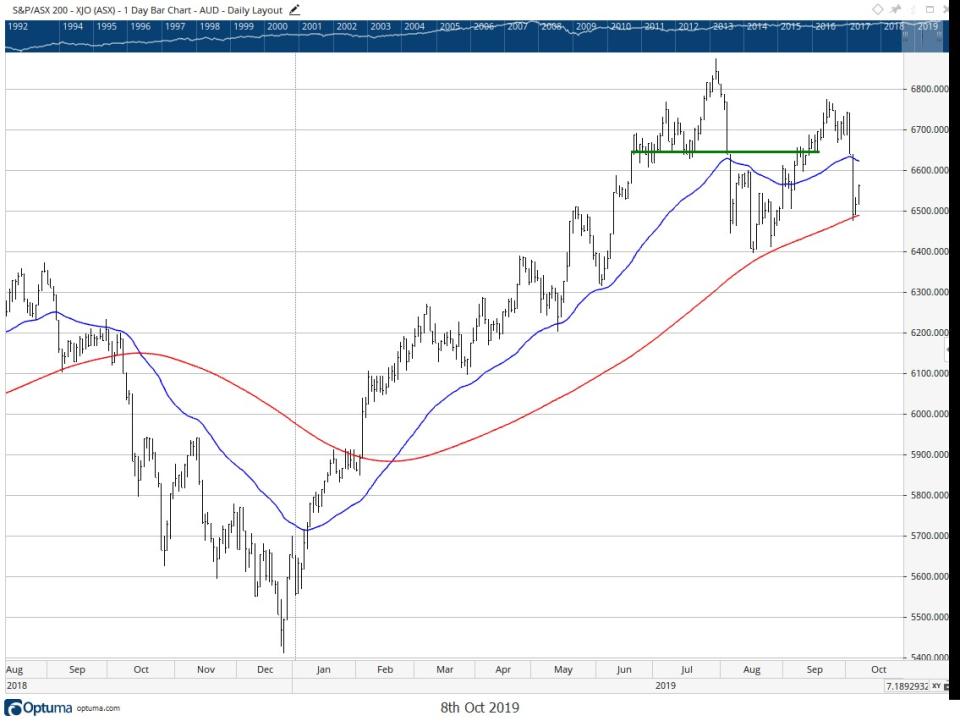
However, the index couldn’t rally to a new high following the August sell-off. For me, this is a red flag. Especially given the July peak was symbolic. That is, it matched the peak from November 2007.
You can see this quite clearly in the longer-term chart, below…
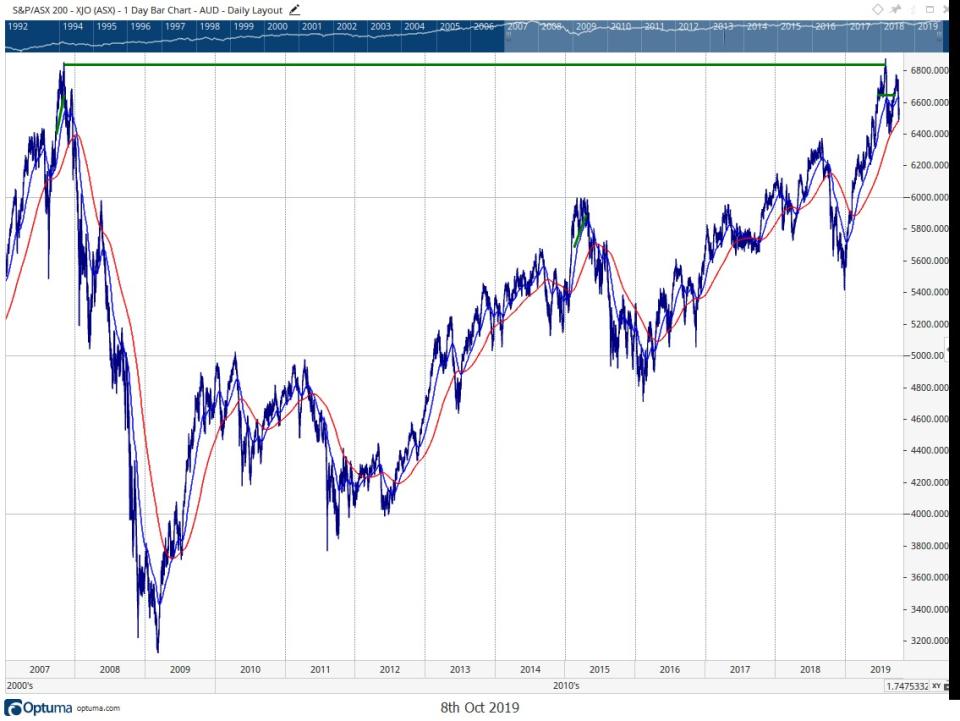
I’ll hasten to add this doesn’t mean another 2008 style meltdown awaits. But I do think the downside risks are greater than upside risks right now.
That is, while the trend of the market remains up, I’m wary of the sell-off continuing in the next few months. The mini panics of August and early October are early warning signs of things to come.
For the ASX 200, keep your eye on the August lows, around 6,400 points. If prices break below there, it increases the chances that the market trend is in the process of changing from bullish to bearish.
That means 2020 could be a very difficult year…
Greg Canavan is the editor of The Rum Rebellion, helping Aussies block out all the nonsense and encourage personal responsibility, both in the financial and political world.
Make your money work with Yahoo Finance’s daily newsletter. Sign up here and stay on top of the latest money, property and tech news.
