
 Yahoo Finance
 Is BHP Group’s (ASX:BHP) Balance Sheet A Threat To Its Future?

BHP Group (ASX:BHP), a large-cap worth AU$176b, comes to mind for investors seeking a strong and reliable stock investment. One reason being its ‘too big to fail’ aura which gives it the appearance of a strong and stable investment. However, the health of the financials determines whether the company continues to succeed. Today we will look at BHP Group’s financial liquidity and debt levels, which are strong indicators for whether the company can weather economic downturns or fund strategic acquisitions for future growth. Note that this information is centred entirely on financial health and is a high-level overview, so I encourage you to look further into BHP here.
See our latest analysis for BHP Group
Does BHP Produce Much Cash Relative To Its Debt?
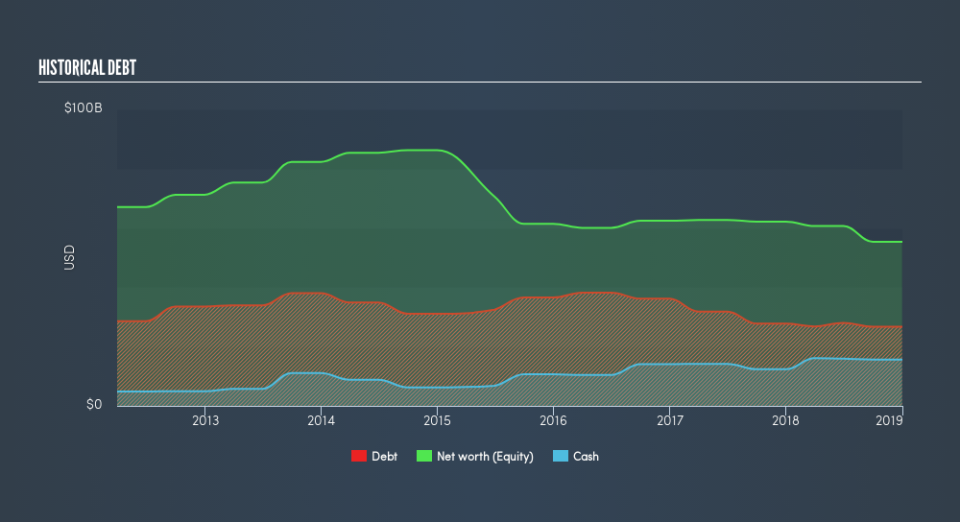
BHP has sustained its debt level by about US$27b over the last 12 months including long-term debt. At this constant level of debt, BHP currently has US$16b remaining in cash and short-term investments to keep the business going. Additionally, BHP has produced US$18b in operating cash flow in the last twelve months, resulting in an operating cash to total debt ratio of 69%, indicating that BHP’s operating cash is sufficient to cover its debt.
Can BHP meet its short-term obligations with the cash in hand?
With current liabilities at US$10b, it appears that the company has maintained a safe level of current assets to meet its obligations, with the current ratio last standing at 2.55x. The current ratio is the number you get when you divide current assets by current liabilities. For Metals and Mining companies, this ratio is within a sensible range as there’s enough of a cash buffer without holding too much capital in low return investments.
Is BHP’s debt level acceptable?
BHP is a relatively highly levered company with a debt-to-equity of 48%. This is common amongst large-cap companies because debt can often be a less expensive alternative to equity due to tax deductibility of interest payments. Accordingly, large companies often have an advantage over small-caps through lower cost of capital due to cheaper financing. No matter how high the company’s debt, if it can easily cover the interest payments, it’s considered to be efficient with its use of excess leverage. Ideally, earnings before interest and tax (EBIT) should cover net interest by at least three times. For BHP, the ratio of 26.77x suggests that interest is amply covered. Large-cap investments like BHP are often believed to be a safe investment due to their ability to pump out ample earnings multiple times its interest payments.
Next Steps:
BHP’s high cash coverage means that, although its debt levels are high, the company is able to utilise its borrowings efficiently in order to generate cash flow. Since there is also no concerns around BHP’s liquidity needs, this may be its optimal capital structure for the time being. Keep in mind I haven’t considered other factors such as how BHP has been performing in the past. I recommend you continue to research BHP Group to get a more holistic view of the large-cap by looking at:
Future Outlook: What are well-informed industry analysts predicting for BHP’s future growth? Take a look at our free research report of analyst consensus for BHP’s outlook.
Valuation: What is BHP worth today? Is the stock undervalued, even when its growth outlook is factored into its intrinsic value? The intrinsic value infographic in our free research report helps visualize whether BHP is currently mispriced by the market.
Other High-Performing Stocks: Are there other stocks that provide better prospects with proven track records? Explore our free list of these great stocks here.
We aim to bring you long-term focused research analysis driven by fundamental data. Note that our analysis may not factor in the latest price-sensitive company announcements or qualitative material.
If you spot an error that warrants correction, please contact the editor at editorial-team@simplywallst.com. This article by Simply Wall St is general in nature. It does not constitute a recommendation to buy or sell any stock, and does not take account of your objectives, or your financial situation. Simply Wall St has no position in the stocks mentioned. Thank you for reading.
