
 Yahoo Finance
 Best&Less Group Holdings' (ASX:BST) Returns Have Hit A Wall
If we want to find a stock that could multiply over the long term, what are the underlying trends we should look for? Amongst other things, we'll want to see two things; firstly, a growing return on capital employed (ROCE) and secondly, an expansion in the company's amount of capital employed. Ultimately, this demonstrates that it's a business that is reinvesting profits at increasing rates of return. Having said that, while the ROCE is currently high for Best&Less Group Holdings (ASX:BST), we aren't jumping out of our chairs because returns are decreasing.
Return On Capital Employed (ROCE): What is it?
If you haven't worked with ROCE before, it measures the 'return' (pre-tax profit) a company generates from capital employed in its business. The formula for this calculation on Best&Less Group Holdings is:
Return on Capital Employed = Earnings Before Interest and Tax (EBIT) ÷ (Total Assets - Current Liabilities)
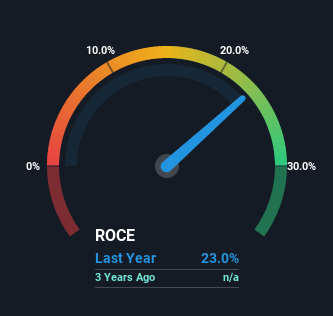
0.23 = AU$53m ÷ (AU$356m - AU$125m) (Based on the trailing twelve months to December 2021).
So, Best&Less Group Holdings has an ROCE of 23%. In absolute terms that's a great return and it's even better than the Specialty Retail industry average of 19%.
See our latest analysis for Best&Less Group Holdings
Above you can see how the current ROCE for Best&Less Group Holdings compares to its prior returns on capital, but there's only so much you can tell from the past. If you'd like to see what analysts are forecasting going forward, you should check out our free report for Best&Less Group Holdings.
What Does the ROCE Trend For Best&Less Group Holdings Tell Us?
Things have been pretty stable at Best&Less Group Holdings, with its capital employed and returns on that capital staying somewhat the same for the last . This tells us the company isn't reinvesting in itself, so it's plausible that it's past the growth phase. So it may not be a multi-bagger in the making, but given the decent 23% return on capital, it'd be difficult to find fault with the business's current operations.
What We Can Learn From Best&Less Group Holdings' ROCE
While Best&Less Group Holdings has impressive profitability from its capital, it isn't increasing that amount of capital. Unsurprisingly then, the total return to shareholders over the last year has been flat. All in all, the inherent trends aren't typical of multi-baggers, so if that's what you're after, we think you might have more luck elsewhere.
Like most companies, Best&Less Group Holdings does come with some risks, and we've found 2 warning signs that you should be aware of.
High returns are a key ingredient to strong performance, so check out our free list ofstocks earning high returns on equity with solid balance sheets.
Have feedback on this article? Concerned about the content? Get in touch with us directly. Alternatively, email editorial-team (at) simplywallst.com.
This article by Simply Wall St is general in nature. We provide commentary based on historical data and analyst forecasts only using an unbiased methodology and our articles are not intended to be financial advice. It does not constitute a recommendation to buy or sell any stock, and does not take account of your objectives, or your financial situation. We aim to bring you long-term focused analysis driven by fundamental data. Note that our analysis may not factor in the latest price-sensitive company announcements or qualitative material. Simply Wall St has no position in any stocks mentioned.
Join A Paid User Research Session
You’ll receive a US$30 Amazon Gift card for 1 hour of your time while helping us build better investing tools for the individual investors like yourself. Sign up here
