
 Yahoo Finance
 Berkshire Hathaway's (NYSE:BRK.A) investors will be pleased with their decent 81% return over the last five years
When you buy and hold a stock for the long term, you definitely want it to provide a positive return. But more than that, you probably want to see it rise more than the market average. Unfortunately for shareholders, while the Berkshire Hathaway Inc. (NYSE:BRK.A) share price is up 81% in the last five years, that's less than the market return. Some buyers are laughing, though, with an increase of 24% in the last year.
So let's investigate and see if the longer term performance of the company has been in line with the underlying business' progress.
View our latest analysis for Berkshire Hathaway
To quote Buffett, 'Ships will sail around the world but the Flat Earth Society will flourish. There will continue to be wide discrepancies between price and value in the marketplace...' By comparing earnings per share (EPS) and share price changes over time, we can get a feel for how investor attitudes to a company have morphed over time.
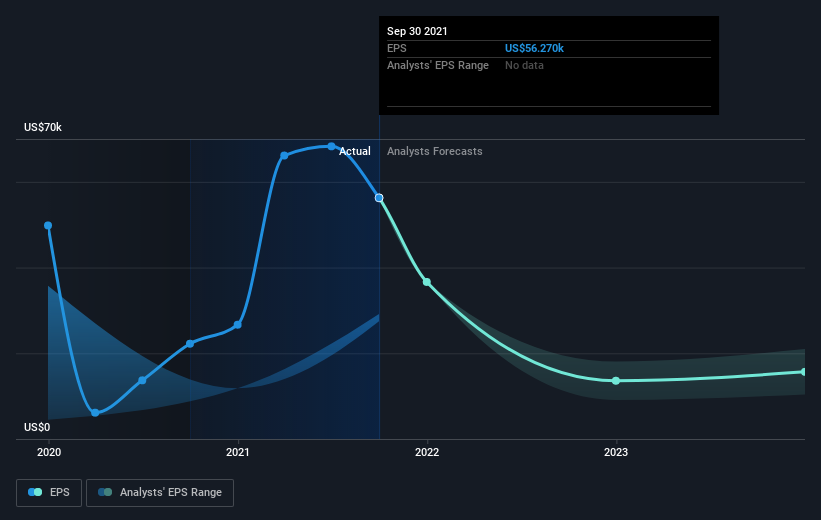
Over half a decade, Berkshire Hathaway managed to grow its earnings per share at 32% a year. The EPS growth is more impressive than the yearly share price gain of 13% over the same period. Therefore, it seems the market has become relatively pessimistic about the company. This cautious sentiment is reflected in its (fairly low) P/E ratio of 7.51.
You can see how EPS has changed over time in the image below (click on the chart to see the exact values).
We're pleased to report that the CEO is remunerated more modestly than most CEOs at similarly capitalized companies. It's always worth keeping an eye on CEO pay, but a more important question is whether the company will grow earnings throughout the years. It might be well worthwhile taking a look at our free report on Berkshire Hathaway's earnings, revenue and cash flow.
A Different Perspective
Berkshire Hathaway shareholders gained a total return of 24% during the year. Unfortunately this falls short of the market return. The silver lining is that the gain was actually better than the average annual return of 13% per year over five year. It is possible that returns will improve along with the business fundamentals. While it is well worth considering the different impacts that market conditions can have on the share price, there are other factors that are even more important. Take risks, for example - Berkshire Hathaway has 1 warning sign we think you should be aware of.
We will like Berkshire Hathaway better if we see some big insider buys. While we wait, check out this free list of growing companies with considerable, recent, insider buying.
Please note, the market returns quoted in this article reflect the market weighted average returns of stocks that currently trade on US exchanges.
This article by Simply Wall St is general in nature. We provide commentary based on historical data and analyst forecasts only using an unbiased methodology and our articles are not intended to be financial advice. It does not constitute a recommendation to buy or sell any stock, and does not take account of your objectives, or your financial situation. We aim to bring you long-term focused analysis driven by fundamental data. Note that our analysis may not factor in the latest price-sensitive company announcements or qualitative material. Simply Wall St has no position in any stocks mentioned.
Have feedback on this article? Concerned about the content? Get in touch with us directly. Alternatively, email editorial-team (at) simplywallst.com.
