
 Yahoo Finance
 Do You Like Bell Financial Group Limited (ASX:BFG) At This P/E Ratio?

This article is written for those who want to get better at using price to earnings ratios (P/E ratios). We’ll show how you can use Bell Financial Group Limited’s (ASX:BFG) P/E ratio to inform your assessment of the investment opportunity. Bell Financial Group has a price to earnings ratio of 10.28, based on the last twelve months. That means that at current prices, buyers pay A$10.28 for every A$1 in trailing yearly profits.
Check out our latest analysis for Bell Financial Group
How Do You Calculate A P/E Ratio?
The formula for P/E is:
Price to Earnings Ratio = Price per Share ÷ Earnings per Share (EPS)
Or for Bell Financial Group:
P/E of 10.28 = A$0.96 ÷ A$0.093 (Based on the year to June 2018.)
Is A High Price-to-Earnings Ratio Good?
A higher P/E ratio means that buyers have to pay a higher price for each A$1 the company has earned over the last year. That is not a good or a bad thing per se, but a high P/E does imply buyers are optimistic about the future.
How Growth Rates Impact P/E Ratios
Probably the most important factor in determining what P/E a company trades on is the earnings growth. When earnings grow, the ‘E’ increases, over time. Therefore, even if you pay a high multiple of earnings now, that multiple will become lower in the future. So while a stock may look expensive based on past earnings, it could be cheap based on future earnings.
It’s nice to see that Bell Financial Group grew EPS by a stonking 50% in the last year. And earnings per share have improved by 32% annually, over the last five years. So we’d generally expect it to have a relatively high P/E ratio.
How Does Bell Financial Group’s P/E Ratio Compare To Its Peers?
The P/E ratio essentially measures market expectations of a company. We can see in the image below that the average P/E (14.5) for companies in the capital markets industry is higher than Bell Financial Group’s P/E.
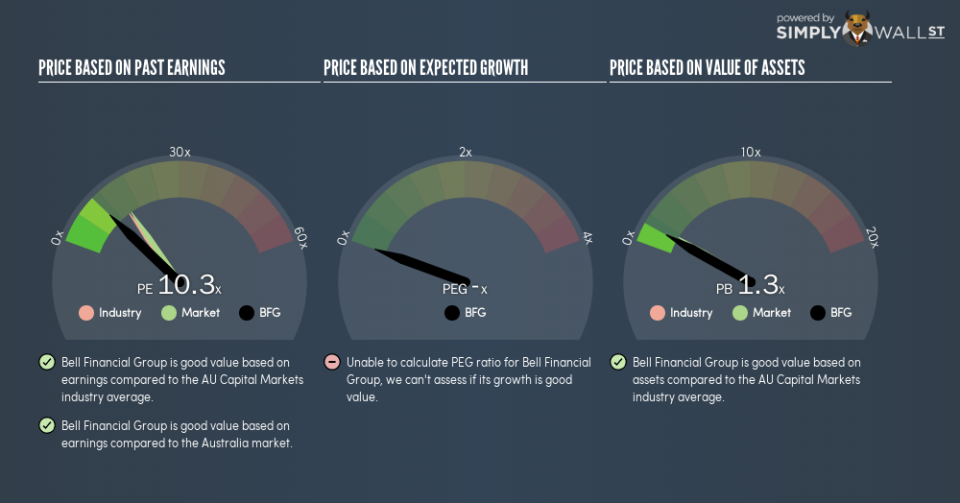
Its relatively low P/E ratio indicates that Bell Financial Group shareholders think it will struggle to do as well as other companies in its industry classification. While current expectations are low, the stock could be undervalued if the situation is better than the market assumes. You should delve deeper. I like to check if company insiders have been buying or selling.
Remember: P/E Ratios Don’t Consider The Balance Sheet
Don’t forget that the P/E ratio considers market capitalization. In other words, it does not consider any debt or cash that the company may have on the balance sheet. In theory, a company can lower its future P/E ratio by using cash or debt to invest in growth.
Such expenditure might be good or bad, in the long term, but the point here is that the balance sheet is not reflected by this ratio.
How Does Bell Financial Group’s Debt Impact Its P/E Ratio?
The extra options and safety that comes with Bell Financial Group’s AU$134m net cash position means that it deserves a higher P/E than it would if it had a lot of net debt.
The Verdict On Bell Financial Group’s P/E Ratio
Bell Financial Group has a P/E of 10.3. That’s below the average in the AU market, which is 15.2. It grew its EPS nicely over the last year, and the healthy balance sheet implies there is more potential for growth. The below average P/E ratio suggests that market participants don’t believe the strong growth will continue.
Investors should be looking to buy stocks that the market is wrong about. If it is underestimating a company, investors can make money by buying and holding the shares until the market corrects itself. We don’t have analyst forecasts, but you could get a better understanding of its growth by checking out this more detailed historical graph of earnings, revenue and cash flow.
Of course you might be able to find a better stock than Bell Financial Group. So you may wish to see this free collection of other companies that have grown earnings strongly.
To help readers see past the short term volatility of the financial market, we aim to bring you a long-term focused research analysis purely driven by fundamental data. Note that our analysis does not factor in the latest price-sensitive company announcements.
The author is an independent contributor and at the time of publication had no position in the stocks mentioned. For errors that warrant correction please contact the editor at editorial-team@simplywallst.com.
