
 Yahoo Finance
 What Is Beacon Lighting Group's (ASX:BLX) P/E Ratio After Its Share Price Rocketed?

Those holding Beacon Lighting Group (ASX:BLX) shares must be pleased that the share price has rebounded 31% in the last thirty days. But unfortunately, the stock is still down by 26% over a quarter. But shareholders may not all be feeling jubilant, since the share price is still down 35% in the last year.
All else being equal, a sharp share price increase should make a stock less attractive to potential investors. While the market sentiment towards a stock is very changeable, in the long run, the share price will tend to move in the same direction as earnings per share. So some would prefer to hold off buying when there is a lot of optimism towards a stock. One way to gauge market expectations of a stock is to look at its Price to Earnings Ratio (PE Ratio). A high P/E ratio means that investors have a high expectation about future growth, while a low P/E ratio means they have low expectations about future growth.
See our latest analysis for Beacon Lighting Group
How Does Beacon Lighting Group's P/E Ratio Compare To Its Peers?
Beacon Lighting Group's P/E is 10.07. The image below shows that Beacon Lighting Group has a P/E ratio that is roughly in line with the specialty retail industry average (10.1).
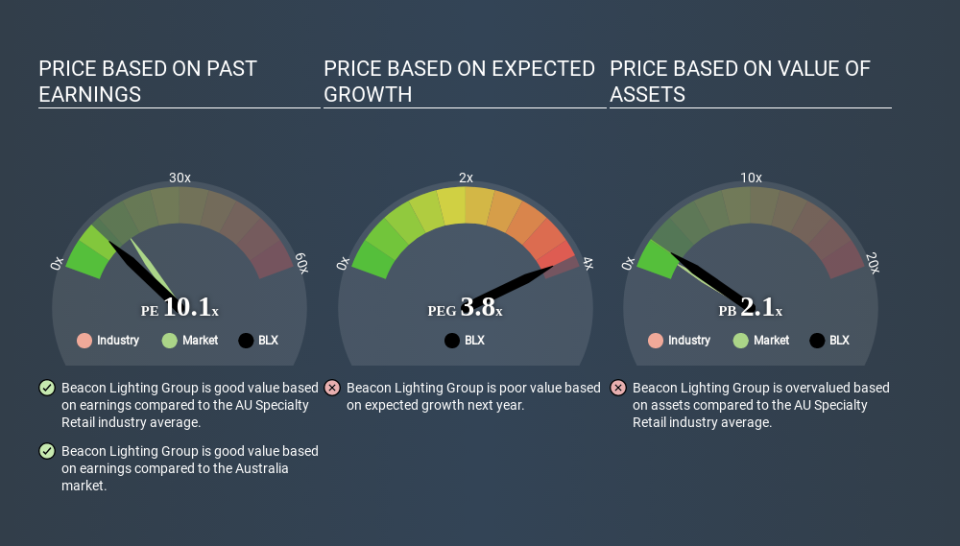
That indicates that the market expects Beacon Lighting Group will perform roughly in line with other companies in its industry. The company could surprise by performing better than average, in the future. Further research into factors such as insider buying and selling, could help you form your own view on whether that is likely.
How Growth Rates Impact P/E Ratios
Earnings growth rates have a big influence on P/E ratios. Earnings growth means that in the future the 'E' will be higher. Therefore, even if you pay a high multiple of earnings now, that multiple will become lower in the future. So while a stock may look expensive based on past earnings, it could be cheap based on future earnings.
Beacon Lighting Group's earnings per share fell by 15% in the last twelve months. But over the longer term (5 years) earnings per share have increased by 3.4%.
A Limitation: P/E Ratios Ignore Debt and Cash In The Bank
Don't forget that the P/E ratio considers market capitalization. In other words, it does not consider any debt or cash that the company may have on the balance sheet. Hypothetically, a company could reduce its future P/E ratio by spending its cash (or taking on debt) to achieve higher earnings.
Such expenditure might be good or bad, in the long term, but the point here is that the balance sheet is not reflected by this ratio.
How Does Beacon Lighting Group's Debt Impact Its P/E Ratio?
Beacon Lighting Group has net debt worth just 4.8% of its market capitalization. It would probably trade on a higher P/E ratio if it had a lot of cash, but I doubt it is having a big impact.
The Verdict On Beacon Lighting Group's P/E Ratio
Beacon Lighting Group has a P/E of 10.1. That's below the average in the AU market, which is 14.9. Since it only carries a modest debt load, it's likely the low expectations implied by the P/E ratio arise from the lack of recent earnings growth. What we know for sure is that investors have become more excited about Beacon Lighting Group recently, since they have pushed its P/E ratio from 7.7 to 10.1 over the last month. If you like to buy stocks that have recently impressed the market, then this one might be a candidate; but if you prefer to invest when there is 'blood in the streets', then you may feel the opportunity has passed.
Investors have an opportunity when market expectations about a stock are wrong. If it is underestimating a company, investors can make money by buying and holding the shares until the market corrects itself. So this free visual report on analyst forecasts could hold the key to an excellent investment decision.
Of course, you might find a fantastic investment by looking at a few good candidates. So take a peek at this free list of companies with modest (or no) debt, trading on a P/E below 20.
Love or hate this article? Concerned about the content? Get in touch with us directly. Alternatively, email editorial-team@simplywallst.com.
This article by Simply Wall St is general in nature. It does not constitute a recommendation to buy or sell any stock, and does not take account of your objectives, or your financial situation. We aim to bring you long-term focused analysis driven by fundamental data. Note that our analysis may not factor in the latest price-sensitive company announcements or qualitative material. Simply Wall St has no position in any stocks mentioned. Thank you for reading.
