
 Yahoo Finance
 Beacon Lighting Group (ASX:BLX) Might Be Having Difficulty Using Its Capital Effectively
What trends should we look for it we want to identify stocks that can multiply in value over the long term? Firstly, we'd want to identify a growing return on capital employed (ROCE) and then alongside that, an ever-increasing base of capital employed. If you see this, it typically means it's a company with a great business model and plenty of profitable reinvestment opportunities. Having said that, while the ROCE is currently high for Beacon Lighting Group (ASX:BLX), we aren't jumping out of our chairs because returns are decreasing.
What is Return On Capital Employed (ROCE)?
For those who don't know, ROCE is a measure of a company's yearly pre-tax profit (its return), relative to the capital employed in the business. Analysts use this formula to calculate it for Beacon Lighting Group:
Return on Capital Employed = Earnings Before Interest and Tax (EBIT) ÷ (Total Assets - Current Liabilities)
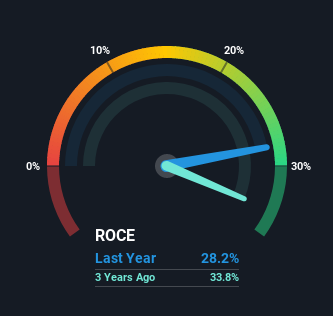
0.28 = AU$60m ÷ (AU$290m - AU$79m) (Based on the trailing twelve months to June 2021).
Thus, Beacon Lighting Group has an ROCE of 28%. That's a fantastic return and not only that, it outpaces the average of 20% earned by companies in a similar industry.
View our latest analysis for Beacon Lighting Group
Above you can see how the current ROCE for Beacon Lighting Group compares to its prior returns on capital, but there's only so much you can tell from the past. If you'd like to see what analysts are forecasting going forward, you should check out our free report for Beacon Lighting Group.
What Can We Tell From Beacon Lighting Group's ROCE Trend?
In terms of Beacon Lighting Group's historical ROCE movements, the trend isn't fantastic. Historically returns on capital were even higher at 44%, but they have dropped over the last five years. However, given capital employed and revenue have both increased it appears that the business is currently pursuing growth, at the consequence of short term returns. If these investments prove successful, this can bode very well for long term stock performance.
On a related note, Beacon Lighting Group has decreased its current liabilities to 27% of total assets. That could partly explain why the ROCE has dropped. Effectively this means their suppliers or short-term creditors are funding less of the business, which reduces some elements of risk. Since the business is basically funding more of its operations with it's own money, you could argue this has made the business less efficient at generating ROCE.
The Bottom Line
In summary, despite lower returns in the short term, we're encouraged to see that Beacon Lighting Group is reinvesting for growth and has higher sales as a result. Furthermore the stock has climbed 87% over the last five years, it would appear that investors are upbeat about the future. So should these growth trends continue, we'd be optimistic on the stock going forward.
On a final note, we've found 1 warning sign for Beacon Lighting Group that we think you should be aware of.
If you want to search for more stocks that have been earning high returns, check out this free list of stocks with solid balance sheets that are also earning high returns on equity.
Have feedback on this article? Concerned about the content? Get in touch with us directly. Alternatively, email editorial-team (at) simplywallst.com.
This article by Simply Wall St is general in nature. We provide commentary based on historical data and analyst forecasts only using an unbiased methodology and our articles are not intended to be financial advice. It does not constitute a recommendation to buy or sell any stock, and does not take account of your objectives, or your financial situation. We aim to bring you long-term focused analysis driven by fundamental data. Note that our analysis may not factor in the latest price-sensitive company announcements or qualitative material. Simply Wall St has no position in any stocks mentioned.
