
 Yahoo Finance
 On the Beach Group (LON:OTB) Could Be Struggling To Allocate Capital
If we want to find a stock that could multiply over the long term, what are the underlying trends we should look for? Firstly, we'll want to see a proven return on capital employed (ROCE) that is increasing, and secondly, an expanding base of capital employed. Basically this means that a company has profitable initiatives that it can continue to reinvest in, which is a trait of a compounding machine. However, after briefly looking over the numbers, we don't think On the Beach Group (LON:OTB) has the makings of a multi-bagger going forward, but let's have a look at why that may be.
Understanding Return On Capital Employed (ROCE)
Just to clarify if you're unsure, ROCE is a metric for evaluating how much pre-tax income (in percentage terms) a company earns on the capital invested in its business. To calculate this metric for On the Beach Group, this is the formula:
Return on Capital Employed = Earnings Before Interest and Tax (EBIT) ÷ (Total Assets - Current Liabilities)
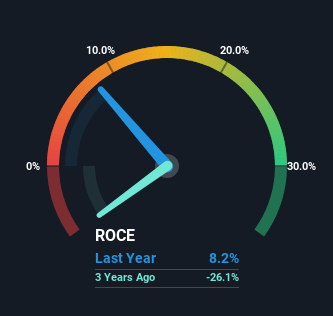
0.082 = UK£14m ÷ (UK£435m - UK£264m) (Based on the trailing twelve months to September 2023).
Therefore, On the Beach Group has an ROCE of 8.2%. On its own that's a low return on capital but it's in line with the industry's average returns of 7.7%.
View our latest analysis for On the Beach Group
In the above chart we have measured On the Beach Group's prior ROCE against its prior performance, but the future is arguably more important. If you'd like, you can check out the forecasts from the analysts covering On the Beach Group for free.
What The Trend Of ROCE Can Tell Us
On the surface, the trend of ROCE at On the Beach Group doesn't inspire confidence. Around five years ago the returns on capital were 22%, but since then they've fallen to 8.2%. However, given capital employed and revenue have both increased it appears that the business is currently pursuing growth, at the consequence of short term returns. And if the increased capital generates additional returns, the business, and thus shareholders, will benefit in the long run.
While on the subject, we noticed that the ratio of current liabilities to total assets has risen to 61%, which has impacted the ROCE. Without this increase, it's likely that ROCE would be even lower than 8.2%. What this means is that in reality, a rather large portion of the business is being funded by the likes of the company's suppliers or short-term creditors, which can bring some risks of its own.
The Bottom Line On On the Beach Group's ROCE
In summary, despite lower returns in the short term, we're encouraged to see that On the Beach Group is reinvesting for growth and has higher sales as a result. And there could be an opportunity here if other metrics look good too, because the stock has declined 67% in the last five years. So we think it'd be worthwhile to look further into this stock given the trends look encouraging.
If you'd like to know about the risks facing On the Beach Group, we've discovered 2 warning signs that you should be aware of.
While On the Beach Group may not currently earn the highest returns, we've compiled a list of companies that currently earn more than 25% return on equity. Check out this free list here.
Have feedback on this article? Concerned about the content? Get in touch with us directly. Alternatively, email editorial-team (at) simplywallst.com.
This article by Simply Wall St is general in nature. We provide commentary based on historical data and analyst forecasts only using an unbiased methodology and our articles are not intended to be financial advice. It does not constitute a recommendation to buy or sell any stock, and does not take account of your objectives, or your financial situation. We aim to bring you long-term focused analysis driven by fundamental data. Note that our analysis may not factor in the latest price-sensitive company announcements or qualitative material. Simply Wall St has no position in any stocks mentioned.
