
 Yahoo Finance
 Has Beach Energy Limited's (ASX:BPT) Impressive Stock Performance Got Anything to Do With Its Fundamentals?
Most readers would already be aware that Beach Energy's (ASX:BPT) stock increased significantly by 13% over the past month. As most would know, fundamentals are what usually guide market price movements over the long-term, so we decided to look at the company's key financial indicators today to determine if they have any role to play in the recent price movement. Specifically, we decided to study Beach Energy's ROE in this article.
Return on Equity or ROE is a test of how effectively a company is growing its value and managing investors’ money. In simpler terms, it measures the profitability of a company in relation to shareholder's equity.
See our latest analysis for Beach Energy
How Is ROE Calculated?
Return on equity can be calculated by using the formula:
Return on Equity = Net Profit (from continuing operations) ÷ Shareholders' Equity
So, based on the above formula, the ROE for Beach Energy is:
12% = AU$401m ÷ AU$3.3b (Based on the trailing twelve months to December 2021).
The 'return' is the income the business earned over the last year. That means that for every A$1 worth of shareholders' equity, the company generated A$0.12 in profit.
What Is The Relationship Between ROE And Earnings Growth?
Thus far, we have learned that ROE measures how efficiently a company is generating its profits. Depending on how much of these profits the company reinvests or "retains", and how effectively it does so, we are then able to assess a company’s earnings growth potential. Assuming everything else remains unchanged, the higher the ROE and profit retention, the higher the growth rate of a company compared to companies that don't necessarily bear these characteristics.
A Side By Side comparison of Beach Energy's Earnings Growth And 12% ROE
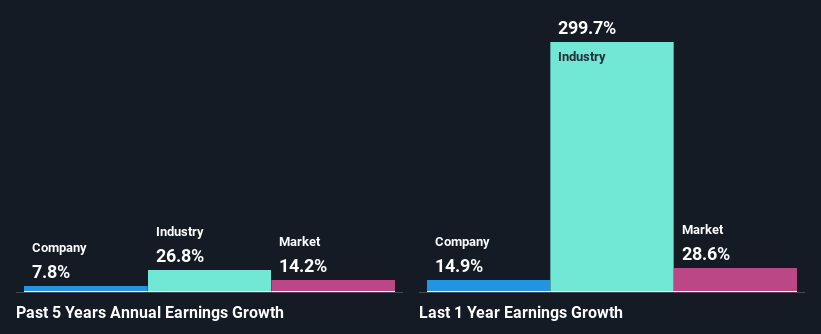
To begin with, Beach Energy seems to have a respectable ROE. Yet, the fact that the company's ROE is lower than the industry average of 16% does temper our expectations. Although, we can see that Beach Energy saw a modest net income growth of 7.8% over the past five years. We reckon that there could be other factors at play here. Such as - high earnings retention or an efficient management in place. However, not to forget, the company does have a decent ROE to begin with, just that it is lower than the industry average. So this also does lend some color to the fairly high earnings growth seen by the company.
Next, on comparing with the industry net income growth, we found that Beach Energy's reported growth was lower than the industry growth of 27% in the same period, which is not something we like to see.
Earnings growth is a huge factor in stock valuation. What investors need to determine next is if the expected earnings growth, or the lack of it, is already built into the share price. By doing so, they will have an idea if the stock is headed into clear blue waters or if swampy waters await. One good indicator of expected earnings growth is the P/E ratio which determines the price the market is willing to pay for a stock based on its earnings prospects. So, you may want to check if Beach Energy is trading on a high P/E or a low P/E, relative to its industry.
Is Beach Energy Using Its Retained Earnings Effectively?
In Beach Energy's case, its respectable earnings growth can probably be explained by its low three-year median payout ratio of 11% (or a retention ratio of 89%), which suggests that the company is investing most of its profits to grow its business.
Moreover, Beach Energy is determined to keep sharing its profits with shareholders which we infer from its long history of paying a dividend for at least ten years. Upon studying the latest analysts' consensus data, we found that the company is expected to keep paying out approximately 11% of its profits over the next three years. Therefore, the company's future ROE is also not expected to change by much with analysts predicting an ROE of 14%.
Conclusion
In total, it does look like Beach Energy has some positive aspects to its business. In particular, it's great to see that the company is investing heavily into its business and along with a moderate rate of return, that has resulted in a respectable growth in its earnings. We also studied the latest analyst forecasts and found that the company's earnings growth is expected be similar to its current growth rate. Are these analysts expectations based on the broad expectations for the industry, or on the company's fundamentals? Click here to be taken to our analyst's forecasts page for the company.
Have feedback on this article? Concerned about the content? Get in touch with us directly. Alternatively, email editorial-team (at) simplywallst.com.
This article by Simply Wall St is general in nature. We provide commentary based on historical data and analyst forecasts only using an unbiased methodology and our articles are not intended to be financial advice. It does not constitute a recommendation to buy or sell any stock, and does not take account of your objectives, or your financial situation. We aim to bring you long-term focused analysis driven by fundamental data. Note that our analysis may not factor in the latest price-sensitive company announcements or qualitative material. Simply Wall St has no position in any stocks mentioned.
Join A Paid User Research Session
You’ll receive a US$30 Amazon Gift card for 1 hour of your time while helping us build better investing tools for the individual investors like yourself. Sign up here
