
 Yahoo Finance
 B&G Foods (BGS) Q4 Earnings Top Estimates, Sales Decline Y/Y

B&G Foods, Inc. BGS posted fourth-quarter 2023 results, wherein the top and bottom lines declined year over year, while both metrics beat the Zacks Consensus Estimate.
Nonetheless, management stated that results reflected solid progress, including better margins, stabilizing volumes, greater cash flows and reduced leverage. Further, the company concluded the sale of Green Giant U.S. canned vegetables during the quarter to strengthen its future portfolio.
Shares of BGS rallied 5.3% in the after-market trading session on Feb 27.
Delving Deeper
B&G Foods posted adjusted earnings of 30 cents per share, which beat the Zacks Consensus Estimate of 28 cents. However, the bottom line slumped 25% year over year.
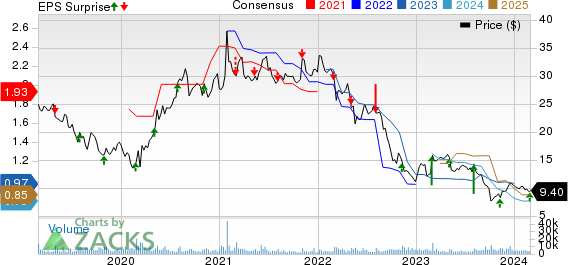
B&G Foods, Inc. Price, Consensus and EPS Surprise
B&G Foods, Inc. price-consensus-eps-surprise-chart | B&G Foods, Inc. Quote
Net sales of $578.1 million declined 7.2% year over year, mainly due to lower unit volumes stemming from the divestitures of the Green Giant U.S. shelf-stable product line (divested on Nov 8, 2023) and Back to Nature (sold on Jan 3, 2023). Also, lower net pricing and foreign currency headwinds weighed on net sales. However, the top line came ahead of the Zacks Consensus Estimate of $573 million.
Base business net sales declined 2.3% to $562.3 million due to lower net pricing, an adverse product mix and currency headwinds, partly made up by higher unit volumes.
Net sales of spices & seasonings, Clabber Girl and Maple Grove Farms rose 0.8%, 26.3%, and 3.4%, respectively. However, net sales of Green Giant (including Le Sueur and excluding Green Giant U.S. shelf-stable product line), Crisco, Ortega and Cream of Wheat declined by 4.4%, 8.7%, 1% and 9%, respectively. Base net sales of all the other brands in the aggregate fell 3.5%.
The adjusted gross profit of $126.8 million decreased from $128.6 million in the year-ago period. The adjusted gross margin expanded 130 basis points (bps) to 21.9%. The gross margin expansion was backed by increased net pricing (relative to input costs), reduced transportation and warehousing costs, moderation of input cost inflation and reduced depreciation expenses.
SG&A expenses escalated 2.7% to $53.2 million due to higher general and administrative expenses and consumer marketing costs, somewhat negated by a decline in warehousing expenses, selling costs and acquisition/divestiture-related and non-recurring expenses. As a percentage of net sales, SG&A expenses climbed 0.9 percentage points to 9.2%.
Adjusted EBITDA fell 7.3% to $86.8 million due to the divestitures. The adjusted EBITDA margin remained flat year over year at 15%. Our model suggested a 14% decline in adjusted EBITDA and a 100-bps contraction in the adjusted EBITDA margin.
Other Updates
B&G Foods ended the quarter with cash and cash equivalents of $41.1 million, net long-term debt of $2,023.1 million and total shareholders’ equity of $835.5 million.
A day prior to the earnings release, management announced a quarterly cash dividend of 19 cents per share, payable on Apr 30, 2024 to shareholders of record as of Mar 28.
Guidance
For fiscal 2024, management anticipates net sales in the band of $1.975-$2.02 billion. In fiscal 2022, net sales amounted to $2,062.3 million ($2.06 billion).
The company anticipates adjusted EBITDA in the range of around $305-$325 million, whereas it recorded $318 million in fiscal 2023.
Adjusted earnings per share (EPS) for fiscal 2024 are envisioned between 80 cents and $1.00. In fiscal 2023, the company posted an adjusted EPS of 99 cents.
Shares of this Zacks Rank #4 (Sell) company have slumped 27% in the past six months compared with the industry’s decline of 0.5%.
3 Appetizing Picks
Post Holdings POST, a consumer-packaged goods holding company, currently sports a Zacks Rank #1 (Strong Buy). POST has a trailing four-quarter earnings surprise of 52.2%, on average. You can see the complete list of today’s Zacks #1 Rank stocks here.
The Zacks Consensus Estimate for Post Holdings’ current financial-year sales and earnings indicates growth of 15.2% and 3.4%, respectively, from the year-ago reported numbers.
Vital Farms Inc. VITL offers a range of produced pasture-raised foods. It currently has a Zacks Rank #2 (Buy). VITL has a trailing four-quarter earnings surprise of 145%, on average.
The Zacks Consensus Estimate for Vital Farms’ current financial-year sales suggests growth of 29.4% from the year-ago reported figure.
Lamb Weston LW, a frozen potato product company, currently carries a Zacks Rank #2. LW has a trailing four-quarter earnings surprise of 28.8%, on average.
The Zacks Consensus Estimate for Lamb Weston’s current fiscal year sales and earnings suggests growth of 28.3% and 26.9%, respectively, from the year-ago period numbers.
Want the latest recommendations from Zacks Investment Research? Today, you can download 7 Best Stocks for the Next 30 Days. Click to get this free report
B&G Foods, Inc. (BGS) : Free Stock Analysis Report
Post Holdings, Inc. (POST) : Free Stock Analysis Report
Lamb Weston (LW) : Free Stock Analysis Report
Vital Farms, Inc. (VITL) : Free Stock Analysis Report
