
 Yahoo Finance
 AUD/USD, NZD/USD, USD/CNY – NZ Dollar Slips, Aussie and Yuan are Steady
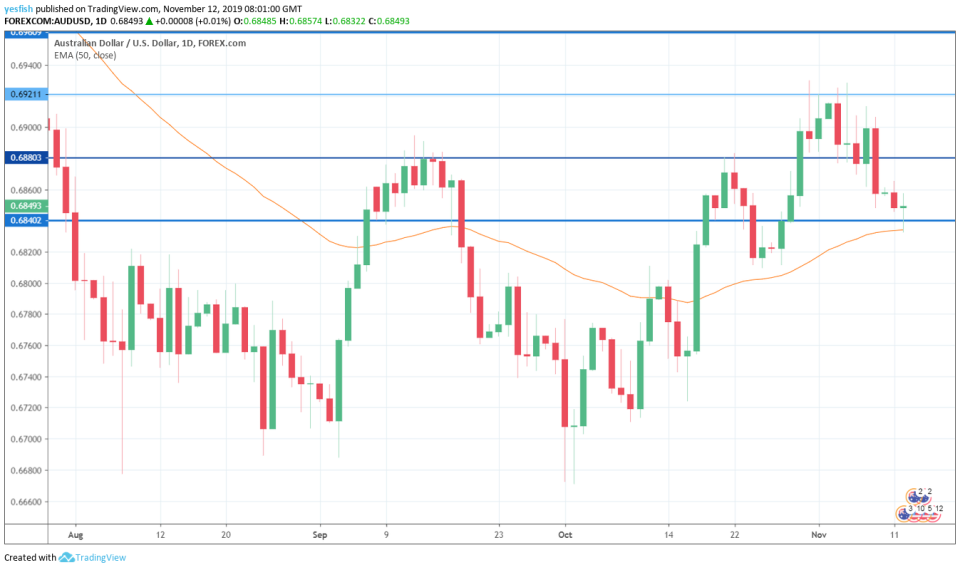
AUD/USD is trading sideways on Tuesday, continuing the trend which started the week. In the European session, the pair is trading at 0.6854, up 0.09% on the day.
Business Confidence Improve
Australian business confidence improved to 2 points in October, good enough for a 3-month high. Still, this reading is below average, as the business sector remains wary about economic conditions.
AUD/USD Technical Analysis
AUD/USD remains range-bound in what has started as a lackluster week. On the upside, there is resistance at 0.6920. On the downside, 0.6840 is an immediate support line and remains vulnerable to a breakout. The 50-EMA line remains relevant and is just below the pair. If the pair breaks below this line, it could continue downwards and push below the 0.6700 level.
USD/CNY
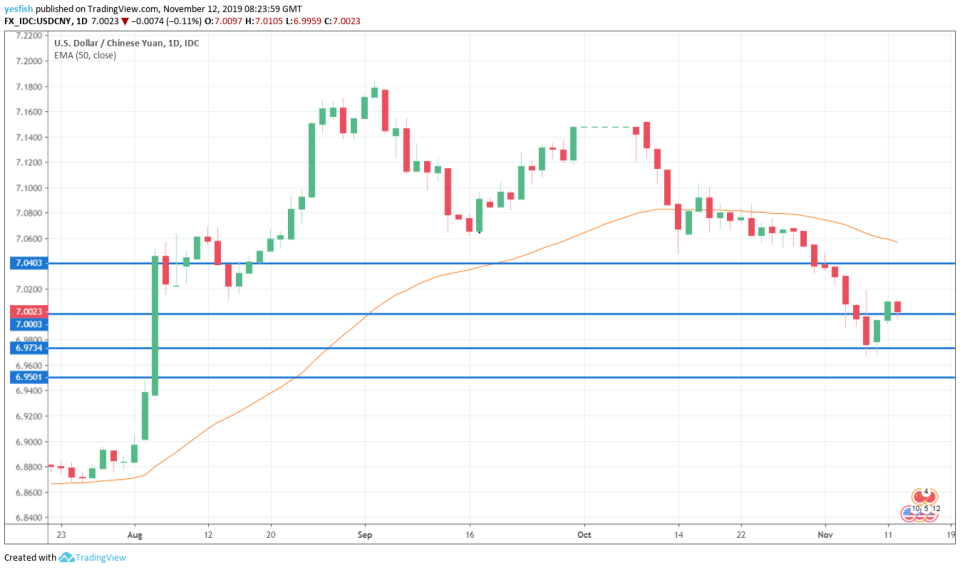
USD/CNY continues to have a quiet week. In Tuesday’s European session, the pair is trading at 7.0030, down 0.09% on the day.
New Bank Loans Slide
New bank loans slowed sharply in October, with a weak release of 661 billion yuan ($94 billion), missing the estimate of 800 billion yuan ($114 billion). This was much lower than the September reading of 1690 billion yuan ($241 billion). This points to weaker investment and consumption, as the trade war continues to hamper the Chinese economy.
USD/CNY Technical Analysis
The pair continues to hover close to the 7.00, which has psychological significance. On the upside, we find resistance at 7.0400. Above, the 50-EMA is currently at 7.0592. On the downside, there is support at 6.9735, which was tested late last week. Below, we have support at 6.9500.
NZD/USD
NZD/USD has reversed directions on Tuesday and coughed up most of the gains made on Monday. In the European session, the pair is trading at 0.6339, down 0.37% on the day.
Inflation Expectations Dips Lower
Inflation Expectations slowed for a fifth straight month, falling to 1.86 percent. This is a key inflation gauge, as inflation expectations often translate into actual inflation readings. With global demand lower and still no trade agreement between the U.S. and China, New Zealand’s economy is under pressure, and this is likely to be reflected with weak inflation data.
NZD/USD Technical Analysis
NZD/USD continues to hover close to the 0.6357 line, which is currently acting as immediate resistance. On the downside, there is support at the round number of 0.6300, which was last tested in mid-October. I continue to monitor the 50-EMA, which is just below the pair and could provide short-term support. Above, we find resistance at 0.6420.

This article was originally posted on FX Empire
