
 Yahoo Finance
 AUD/USD Forex Technical Analysis – Primary Upside Target is Short-Term Retracement Zone at .6098 – .6236
The Australian Dollar settled into a range on Friday after plunging to an 18-year low the previous session. Traders attributed the move to profit-taking and position-squaring ahead of the weekend. Analysts warned, however, it was too early to call an end to the rout that saw a global scramble for the U.S. Dollar throughout the week.
On Friday, the AUD/USD settled at .5803, up 0.0060 or +1.04%.
Daily Technical Analysis
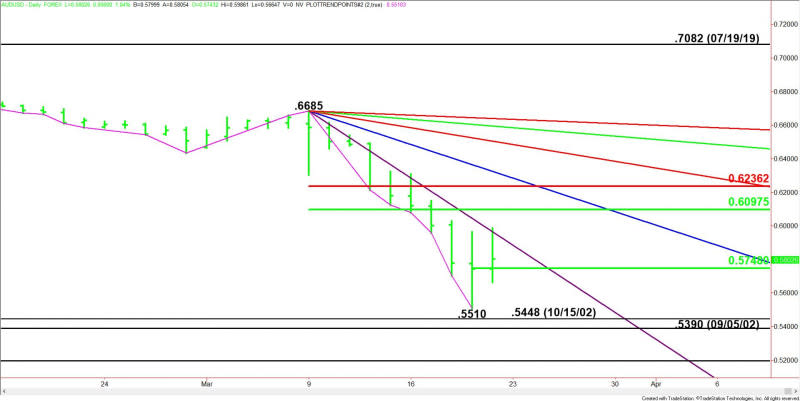
The main trend is down according to the daily swing chart. A trade through .5510 will signal a resumption of the downtrend. The main trend will change to up on a move through .6685. This is highly unlikely, but there is room for a normal 50% to 61.8% retracement of the recent short-term break.
The minor trend is also down. However, a new minor bottom has formed at .5510. This could be an early sign that momentum may be getting ready to shift to the upside.
The minor range is .5510 to .5986. Its 50% level or pivot at .5748 is potential support. Holding above this level will indicate that counter-trend buyers are coming in to support the AUD/USD.
The short-term range is .6685 to .5510. Its retracement zone at .6097 to .6236 is the primary upside target. Since the main trend is down, sellers are likely to come in on a test of this area.
Short-Term Outlook
On Friday, the steep downtrending Gann angle at .5965 provided resistance. This angle, moving at a rate of 0.0080 per day, has been guiding the Forex pair lower since the March 9 main top at .6685. Due to the prolonged move down in terms of price and time, this angle is also a potential trigger point for an acceleration to the upside.
A breakout over the Gann angle could trigger a rally into the retracement zone at .6098 to .6098. Sellers are likely to show up on a test of this area.
On the downside, the key level to watch is the minor pivot at .5758. If this level fails as support then look for the selling to possibly lead to a retest of the minor bottom at .5510.
If the 18-year low at .5510 fails then look for the selling to possibly extend into the October 15, 2002 main bottom at .5448. This is followed by the September 5, 2002 main bottom at .5390.
This article was originally posted on FX Empire
More From FXEMPIRE:
EOS, Ethereum and Ripple’s XRP – Daily Tech Analysis – 21/03/20
Silver Weekly Price Forecast – Silver Markets Collapsed for the Week
Oil Price Fundamental Daily Forecast – Lower Prices Until Saudi Arabia and Russia End Price War
Crude Oil Weekly Price Forecast – Crude Oil Markets Have Rough Week Again
S&P 500 Price Forecast – Stock Markets Limp Into the Weekend
