
 Yahoo Finance
 AUD/USD Forex Technical Analysis – Gann Angle at .6802 Controlling Today’s Direction
The Australian Dollar is trading higher on Thursday after confirming yesterday’s dramatic closing price reversal bottom. The chart pattern and follow-through rally doesn’t signal a change in trend, but it often fuels the start of a 2 to 3 day counter-trend rally. The upside target is typically 50% to 61.8% of the recent decline. That’s the move we’re looking for over the near-term. However, in order to complete the chart pattern, global yields are going to have to continue to rise, and the Chinese yuan is going to have to remain above the 7 yuan to the dollar level.
At 13:49, the AUD/USD is trading .6801, up 0.0041 or +0.60%.
The chart pattern usually occurs following a prolonged move in terms of price and time and it’s often news driven because something unexpected has to happen to drive the shorts out of the market. Remember that the first leg up from a bottom is short-covering. That’s what we’re seeing now. Once the short-covering dries up, the market pulls back about 50% of its initial rally. If real buyers come in on this break then a secondary higher bottom will form. So we have a long way to go before we’ll see a change in trend, if at all.
Daily Technical Analysis
The main trend is down according to the daily swing chart. However, momentum shifted to the upside with the formation of the closing price reversal bottom and the subsequent confirmation earlier today.
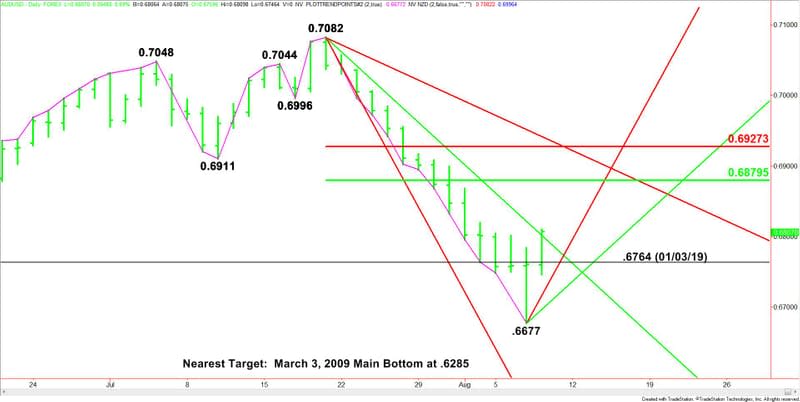
The main trend will change to up on a trade through .7082. This is highly unlikely, however, there is room for a normal 50% to 61.8% retracement.
A trade through .6677 will negate the closing price reversal bottom and signal a resumption of the downtrend.
The main range is .7082 to .6677. Its retracement zone at .6880 to .6927 is the primary upside target.
Daily Technical Forecast
Based on the early price action and the current price at .6801, the direction of the AUD/USD the rest of the session is likely to be determined by trader reaction to the downtrending Gann angle at .6802.
Bullish Scenario
A sustained move over .6802 will indicate the presence of buyers. If this move creates enough upside momentum then look for a potential acceleration to the upside with the 50% level at .6780 the next upside target.
Bearish Scenario
A sustained move under .6802 will signal the presence of sellers. If this creates enough downside momentum then look for a 50% retracement of the first leg up from the bottom. This price level is about .6744. This is followed by uptrending Gann angles at .6717 and .6697 then the .6677 main bottom.
This article was originally posted on FX Empire
