
 Yahoo Finance
 AUD/USD Forex Technical Analysis – Trying to Establish Support at .7711-.7669 Short-Term Retracement Zone
The Australian Dollar is edging higher on Monday on light volume with the markets closed domestically for a public holiday. The Fed’s two-day policy meeting will likely dominate investor behavior in the Australian Dollar. Although the central bank is not expected to take any action, its forecasts for interest rates, inflation and the economy could move the greenback and Aussie.
At 11:13 GMT, the AUD/USD is trading .7718, up 0.0015 or +0.19%.
In Australia, investors will get the opportunity to react to a speech by RBA Governor Philip Lowe on June 17, shortly before the release of reports on Employment Change and Unemployment Rate. The Employment Change report is expected to show the economy added 30.5K new jobs, offsetting last month’s dismal -30.6K reading. The Unemployment Rate is expected to remain steady at 5.5%.
Daily Swing Chart Technical Analysis
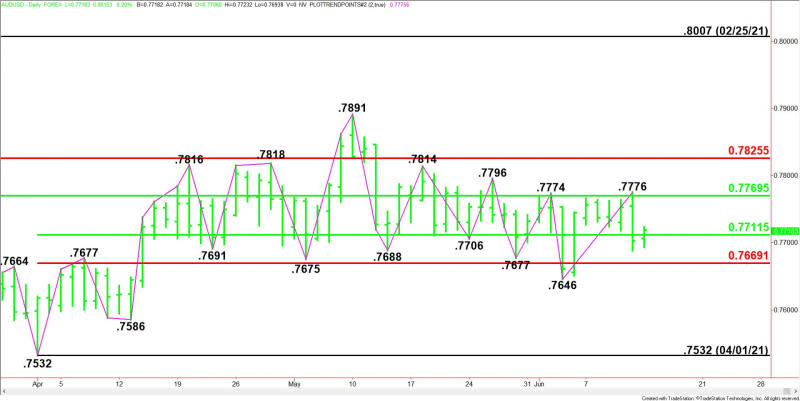
The main trend changed to up on Friday when buyers took out the previous main top at .7774, but the rally stalled at .7776. Technically, a trade through this level will signal a resumption of the uptrend, while a move through .7646 will change the main trend to down.
The minor trend changed to down on Friday. This shifted momentum to the downside.
The short-term range is .7532 to .7891. Its retracement zone at .7711 to .7669 is currently being tested. This zone has provided support for over a month.
The minor range is .7646 to .7776. Its 50% level or pivot at .7711 forms a support cluster with the short-term 50% level.
The main range is .8007 to .7532. Its retracement zone at .7770 to .7826 is major resistance, having stopped rallies four times since early May.
Daily Swing Chart Technical Forecast
The direction of the AUD/USD on Monday is likely to be determined by trader reaction to the short-term 50% level at .7711.
Bullish Scenario
A sustained move over .7712 will indicate the presence of buyers. If this move can create enough upside momentum this week then look for the move to extend into at least .7770 to .7776.
Bearish Scenario
A sustained move under .7711 will signal the presence of sellers. This could trigger a resumption of the sell-off with the next target .7669, followed by .7646.
For a look at all of today’s economic events, check out our economic calendar.
This article was originally posted on FX Empire
More From FXEMPIRE:
Nvidia Is Struggling To Get The Arm Deal Done. Qualcomm Is Looking In
USD/INR Posts Longest Daily Losing Streak in Over Two Months
Gold Price Forecast – Gold Markets Recover After Initial Selloff
Crude Oil Price Forecast – Crude Oil Continues to Reach Higher
Natural Gas Price Forecast – Natural Gas Continues to Ride Commodity Boom
Natural Gas Price Fundamental Daily Forecast – Prices Could Tumble if TETCO Gas is Rerouted
