
 Yahoo Finance
 AUD/USD Forex Technical Analysis – April 19, 2018 Forecast
The Australian Dollar is trading higher shortly before the U.S. opening. The currency was pressured earlier in the session by the release of a weaker-than-expected employment report.
At 0946 GMT, the AUD/USD is trading .7794, up 0.0011 or 0.16%.
Although the slowdown in the pace of jobs growth supports the Reserve Bank of Australia’s decision to keep interest rates at historically low levels and the interest rate differential favors the U.S. Dollar, the Australian Dollar is being supported by the surge in commodity prices, namely the industrial metals. After all, it is a commodity-driven currency.
Daily Technical Analysis
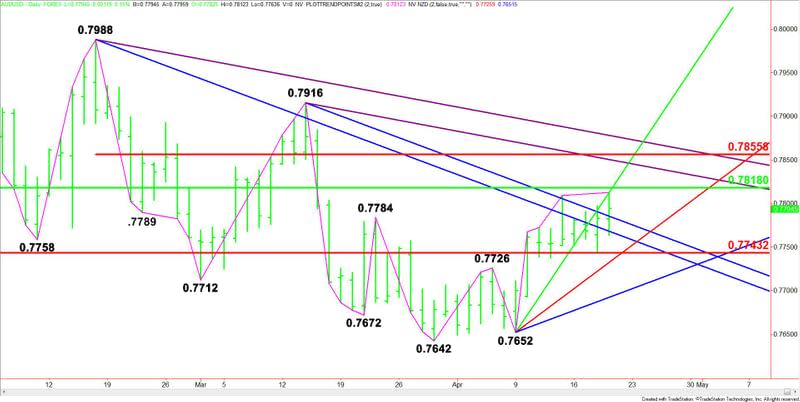
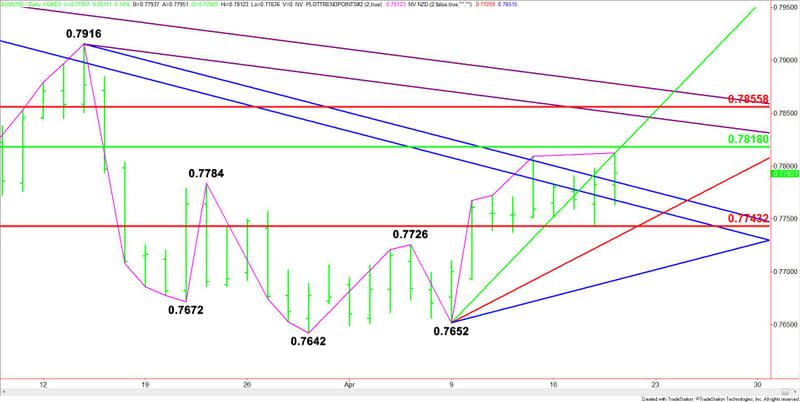
The main trend is up according to the daily swing chart. The market is up eight sessions from the last main bottom so we still have to watch for a potentially bearish closing price reversal top. A trade back below the previous top at .7784 will also be a sign of weakness.
The minor trend will change to down on a trade through .7743. This will also signal a shift in momentum to down.
The major range is .7501 to .8135. The market is currently trading inside its retracement zone at .7818 to .7743. This zone is controlling the longer-term direction of the market.
The main range is .7988 to .7642. Its retracement zone at .7815 to .7856 is the next upside target zone.
The combination of the two zone forms a potential resistance cluster at .7815 to .7818. We could see a technical bounce on the first test of this zone.
Daily Technical Forecast
Based on the current price at .7796, the nearest upside target is an uptrending Gann angle at .7812. This is followed by the 50% levels at .7815 and .7818. This area is currently acting like resistance.
Overtaking .7818 will indicate the buying is getting stronger. If this generates enough upside momentum, we could see a drive into the downtrending Gann angle at .7851, followed by a Fibonacci level at .7856.
The inability to overcome .7812 will signal the presence of sellers. Crossing to the weak side of downtrending Gann angles at .7685 and .7612 will indicate the selling is getting stronger. This could lead to a test of the major Fibonacci level at .7743, followed by an uptrending Gann angle .7732.
This article was originally posted on FX Empire
