
 Yahoo Finance
 AUD/USD Forex Technical Analysis – Reaction to .7743 Determines Whether Secondary Lower Top is Forming
The Australian Dollar is inching lower early Wednesday after rising up from a one-week low as a decline in U.S. Treasury yields weakened the U.S. Dollar, making the commodity-linked Aussie a more attractive investment.
A bond-market sell-off has driven U.S. Treasury yields sharply higher at the start of 2021, stalling the rally in the Australian Dollar. That move was fueled by Democrats winning control of U.S. Congress at elections in Georgia last week. Mixed signals from some U.S. Federal Reserve members as to how much longer policy can stay so accommodative also dragged on Treasuries.
At 06:43 GMT, the AUD/USD is trading .7766, down 0.008 or -0.11%.
Benchmark 10-year Treasury yields fell more than 6 basis points from a 10-month high hit on Tuesday and the turnaround snuffed out a three-day streak for the dollar.
Daily Swing Chart Technical Analysis
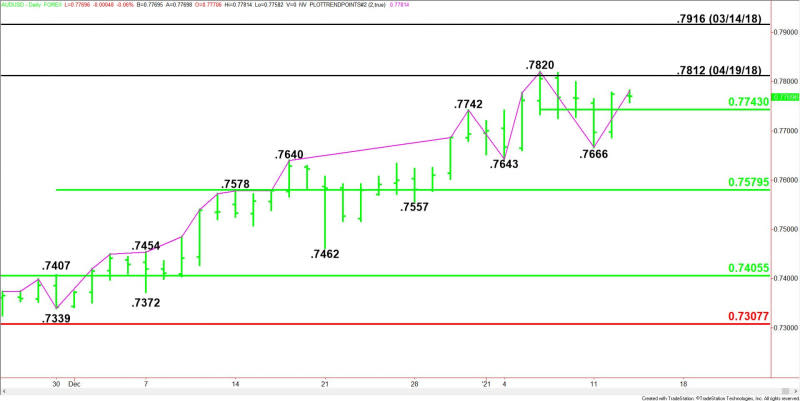
The main trend is up according to the daily swing chart. A trade through .7666 will change the main trend to down, while a move through .7820 will signal a resumption of the uptrend.
The minor range is .7820 to .7666. Based on the early price action, its 50% level at .7743 is potential support. This price level could act like a pivot throughout the session.
The short-term range is .7339 to .7820. If the main trend changes to down, its 50% level at .7579 will become the primary downside target.
Daily Swing Chart Technical Forecast
The direction of the AUD/USD on Wednesday is likely to be determined by trader reaction to the pivot at .7743.
Bullish Scenario
A sustained move over .7743 will indicate the presence of buyers. If this move creates enough upside momentum then look for buyers to make a run at .7820.
Taking out .7820 will signal a resumption of the uptrend. This could trigger an acceleration to the upside or a steady move into the March 14, 2018 main top at .7916.
Bearish Scenario
A sustained move under .7743 will signal the presence of sellers. This will also be an early indication that a potentially bearish secondary lower top is being formed. This could generate the downside momentum needed to challenge .7666. Taking out this level will change the main trend to down.
For a look at all of today’s economic events, check out our economic calendar.
This article was originally posted on FX Empire
More From FXEMPIRE:
USD/JPY Forex Technical Analysis – Held 103.496 Support But Needs Higher US Rates to Resume Rally
Deutsche Post Shares Gain on Strong Profit Outlook; Target Price EUR 53
EOS, Stellar’s Lumen, and Tron’s TRX – Daily Analysis – January 13th, 2021
Gold Price Futures (GC) Technical Analysis – Late Session Short-Covering Rally Could Target $1889.80
