
 Yahoo Finance
 AUD/USD Forex Technical Analysis – September 20, 2018 Forecast
The Australian Dollar is trading lower and inside yesterday’s range early Thursday following the release of the latest RBA Bulletin. Today’s bulletin highlighted the risks the Consumer Discretionary sector is facing amid increased competition, slow growth in consumer spending, plus the changes in consumer preferences. The RBA Bulletin also showed that long-term six-month average changes are astronomical, with online sales soaring since 2016 and in-store sales tracking lower from 2014 to now.
At 0605 GMT, the AUD/USD is trading .7258, down 0.0008 or -0.09%.
Daily Technical Analysis
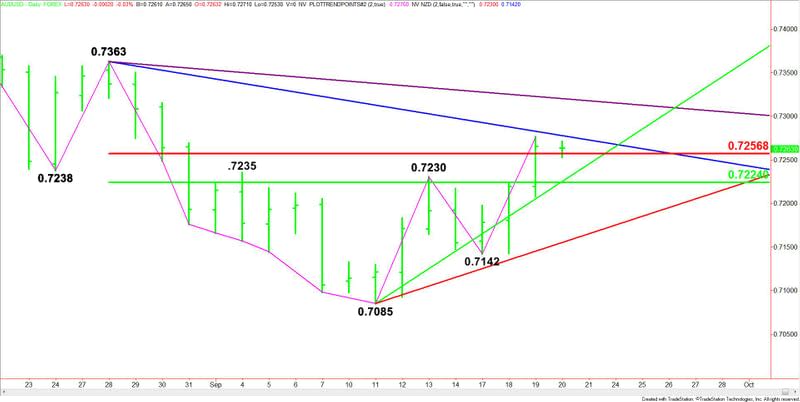
The main trend is up according to the daily swing chart. The next upside target on the swing chart is .7363. The trend changes to down on a trade through .7142.
The main range is .7363 to .7085. Its retracement zone is .7257 to .7224. This zone is support. It is also controlling the near-term direction of the Forex pair. Holding above it will help maintain the upside bias.
Daily Technical Forecast
Based on the early price action, the direction of the AUD/USD on Thursday is likely to be determined by trader reaction to the Fibonacci level at .7257.
A sustained move over .7257 will indicate the presence of buyers. The next target angle drops in at .7278. Look for a technical bounce on the first test of this angle. However, it is also the trigger point for a potential acceleration to the upside with the next target angle coming in at .7321. This is the last potential resistance angle before the .7363 main top.
A sustained move under .7257 will signal the presence of sellers. If this move generates enough downside momentum then look for a potential break into a support cluster at .7225 to .7224. Since the trend is up, buyers are likely to come in on a test of this area.
A failure to hold .7224 will indicate the selling pressure is getting stronger. The daily chart indicates there is plenty of room to the downside with the next target angle coming in at .7155, followed by the main bottom at .7142.
This article was originally posted on FX Empire
