
 Yahoo Finance
 AUD/USD Forex Technical Analysis – Weekly Wall of Resistance Layered at .7252, .7307 and .7349
A positive outlook for the economy from the Reserve Bank of Australia helped underpin the Australian Dollar last week, but gains were limited by another hawkish monetary policy statement by the U.S. Federal Reserve. The Aussie was also helped by stronger than expected trade data out of China, its largest trading partner.
Last week, the AUD/USD settled at .7228, up 0.0030 or +0.41%.
The Reserve Bank of Australia left the official interest rate unchanged for the 27th consecutive month at its monetary policy meeting and gave no indication it would lift rates from a record-low 1.50 percent any time soon. “The Australian economy is performing well,” Dr. Lowe said.
Meanwhile, the U.S. Federal Reserve also left its benchmark interest rate unchanged, while reaffirming the likelihood of another rate hike in December.
Weekly Swing Chart Technical Analysis
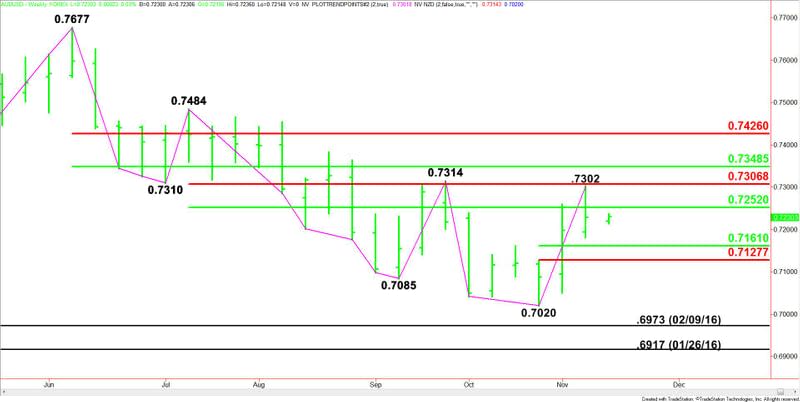
The main trend is down according to the weekly swing chart. The two week rally has put the AUD/USD in a position to challenge the last main top at .7314. A trade through this level will change the main trend to up. A move through .7020 will signal the resumption of the downtrend.
The new short-term range is .7020 to .7302. Its retracement zone at .7161 to .7128 is the primary downside target.
The intermediate range is .7484 to .7020. Its retracement zone at .7252 to .7307 is the first upside target. This zone was tested last week when the Forex pair rallied to .7302.
The main range is .7677 to .7020. Its retracement zone at .7349 to .7426 is the next upside target.
Weekly Swing Chart Technical Forecast
Based on last week’s close at .7228, the direction of the AUD/USD this week is likely to be determined by trader reaction to the intermediate 50% level at .7252.
A sustained move under .7252 will indicate the presence of sellers. If this move generates enough downside momentum then look for the selling to extend into the short-term retracement zone at .7161 to .7128. This is a key area because aggressive counter-trend buyers may attempt to form a secondary higher bottom on a test of this area.
A sustained move over .7252 will signal the presence of buyers. The next rally, however, is likely to be labored because of a series of potential resistance levels including last week’s high at .7302, the intermediate Fibonacci level at .7307, a main top at .7314 and the main 50% level at .7349.
The trigger point for an acceleration to the upside is .7349. Overtaking this level with rising volume could drive the AUD/USD into the main Fibonacci level at .7426.
This article was originally posted on FX Empire
More From FXEMPIRE:
Will Saudi’s Cut in Oil Exports in December Fuel Short-Covering Rally?
USD/JPY Forex Technical Analysis – In Position to Challenge One-Year High at 114.728
Bitcoin Treads Water as Bitcoin Cash Gets Hit with more Bad News
AUD/USD Forex Technical Analysis – Weekly Wall of Resistance Layered at .7252, .7307 and .7349
