
 Yahoo Finance
 Will AUB Group Limited (ASX:AUB) Continue To Underperform Its Industry?

I am writing today to help inform people who are new to the stock market and want a simplistic look at the return on AUB Group Limited (ASX:AUB) stock.
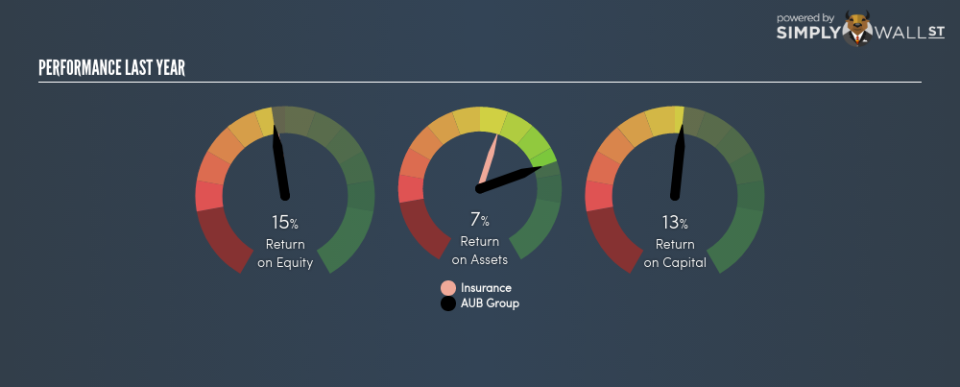
AUB Group Limited (ASX:AUB) delivered a less impressive 14.60% ROE over the past year, compared to the 14.99% return generated by its industry. An investor may attribute an inferior ROE to a relatively inefficient performance, and whilst this can often be the case, knowing the nuts and bolts of the ROE calculation may change that perspective and give you a deeper insight into AUB’s past performance. I will take you through how metrics such as financial leverage impact ROE which may affect the overall sustainability of AUB’s returns. View out our latest analysis for AUB Group
Peeling the layers of ROE – trisecting a company’s profitability
Firstly, Return on Equity, or ROE, is simply the percentage of last years’ earning against the book value of shareholders’ equity. For example, if the company invests A$1 in the form of equity, it will generate A$0.15 in earnings from this. While a higher ROE is preferred in most cases, there are several other factors we should consider before drawing any conclusions.
Return on Equity = Net Profit ÷ Shareholders Equity
ROE is measured against cost of equity in order to determine the efficiency of AUB Group’s equity capital deployed. Its cost of equity is 8.55%. While AUB Group’s peers may have higher ROE, it may also incur higher cost of equity. An undesirable and unsustainable practice would be if returns exceeded cost. However, this is not the case for AUB Group which is encouraging. ROE can be split up into three useful ratios: net profit margin, asset turnover, and financial leverage. This is called the Dupont Formula:
Dupont Formula
ROE = profit margin × asset turnover × financial leverage
ROE = (annual net profit ÷ sales) × (sales ÷ assets) × (assets ÷ shareholders’ equity)
ROE = annual net profit ÷ shareholders’ equity
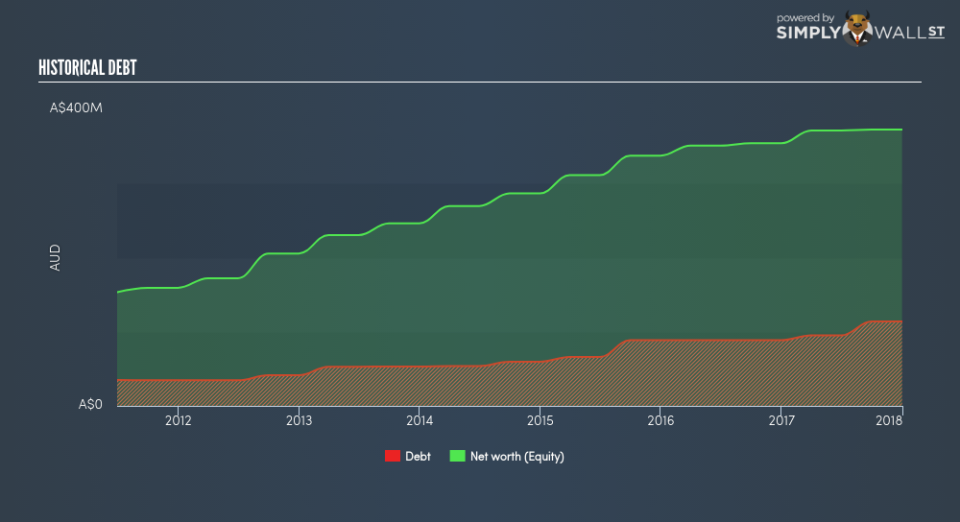
Essentially, profit margin shows how much money the company makes after paying for all its expenses. The other component, asset turnover, illustrates how much revenue AUB Group can make from its asset base. The most interesting ratio, and reflective of sustainability of its ROE, is financial leverage. Since ROE can be inflated by excessive debt, we need to examine AUB Group’s debt-to-equity level. At 30.58%, AUB Group’s debt-to-equity ratio appears low and indicates that AUB Group still has room to increase leverage and grow its profits.
Next Steps:
ROE is one of many ratios which meaningfully dissects financial statements, which illustrates the quality of a company. While AUB Group exhibits a weak ROE against its peers, its returns are sufficient enough to cover its cost of equity. Its appropriate level of leverage means investors can be more confident in the sustainability of AUB Group’s return with a possible increase should the company decide to increase its debt levels. ROE is a helpful signal, but it is definitely not sufficient on its own to make an investment decision.
For AUB Group, I’ve compiled three essential aspects you should further research:
Financial Health: Does it have a healthy balance sheet? Take a look at our free balance sheet analysis with six simple checks on key factors like leverage and risk.
Management:Have insiders been ramping up their shares to take advantage of the market’s sentiment for AUB Group’s future outlook? Check out our management and board analysis with insights on CEO compensation and governance factors.
Other High-Growth Alternatives : Are there other high-growth stocks you could be holding instead of AUB Group? Explore our interactive list of stocks with large growth potential to get an idea of what else is out there you may be missing!
To help readers see pass the short term volatility of the financial market, we aim to bring you a long-term focused research analysis purely driven by fundamental data. Note that our analysis does not factor in the latest price sensitive company announcements.
The author is an independent contributor and at the time of publication had no position in the stocks mentioned.
