
 Yahoo Finance
 Astec Industries' (NASDAQ:ASTE) earnings have declined over three years, contributing to shareholders 42% loss
While it may not be enough for some shareholders, we think it is good to see the Astec Industries, Inc. (NASDAQ:ASTE) share price up 21% in a single quarter. But that doesn't change the fact that the returns over the last three years have been less than pleasing. In fact, the share price is down 44% in the last three years, falling well short of the market return.
On a more encouraging note the company has added US$51m to its market cap in just the last 7 days, so let's see if we can determine what's driven the three-year loss for shareholders.
Check out our latest analysis for Astec Industries
In his essay The Superinvestors of Graham-and-Doddsville Warren Buffett described how share prices do not always rationally reflect the value of a business. By comparing earnings per share (EPS) and share price changes over time, we can get a feel for how investor attitudes to a company have morphed over time.
During five years of share price growth, Astec Industries moved from a loss to profitability. That would generally be considered a positive, so we are surprised to see the share price is down. So it's worth looking at other metrics to try to understand the share price move.
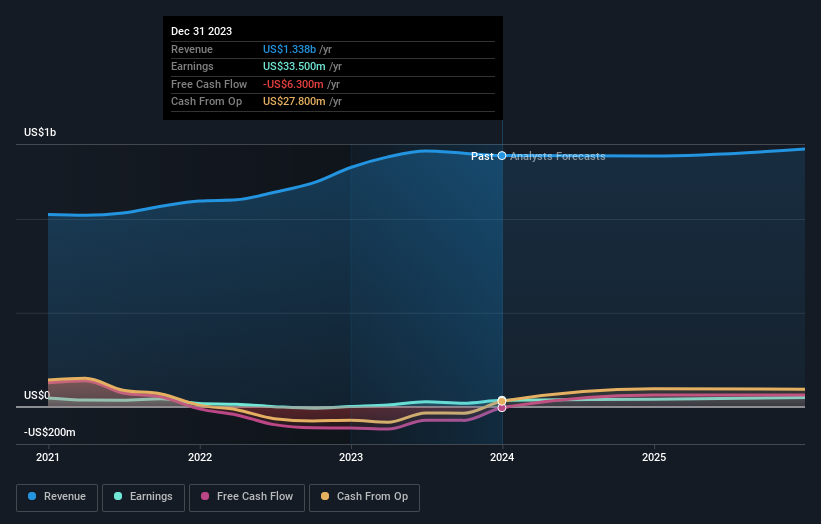
With a rather small yield of just 1.2% we doubt that the stock's share price is based on its dividend. We note that, in three years, revenue has actually grown at a 11% annual rate, so that doesn't seem to be a reason to sell shares. This analysis is just perfunctory, but it might be worth researching Astec Industries more closely, as sometimes stocks fall unfairly. This could present an opportunity.
You can see how earnings and revenue have changed over time in the image below (click on the chart to see the exact values).
We know that Astec Industries has improved its bottom line lately, but what does the future have in store? You can see what analysts are predicting for Astec Industries in this interactive graph of future profit estimates.
A Different Perspective
Astec Industries provided a TSR of 11% over the last twelve months. Unfortunately this falls short of the market return. The silver lining is that the gain was actually better than the average annual return of 7% per year over five year. It is possible that returns will improve along with the business fundamentals. I find it very interesting to look at share price over the long term as a proxy for business performance. But to truly gain insight, we need to consider other information, too. For instance, we've identified 1 warning sign for Astec Industries that you should be aware of.
But note: Astec Industries may not be the best stock to buy. So take a peek at this free list of interesting companies with past earnings growth (and further growth forecast).
Please note, the market returns quoted in this article reflect the market weighted average returns of stocks that currently trade on American exchanges.
Have feedback on this article? Concerned about the content? Get in touch with us directly. Alternatively, email editorial-team (at) simplywallst.com.
This article by Simply Wall St is general in nature. We provide commentary based on historical data and analyst forecasts only using an unbiased methodology and our articles are not intended to be financial advice. It does not constitute a recommendation to buy or sell any stock, and does not take account of your objectives, or your financial situation. We aim to bring you long-term focused analysis driven by fundamental data. Note that our analysis may not factor in the latest price-sensitive company announcements or qualitative material. Simply Wall St has no position in any stocks mentioned.
