
 Yahoo Finance
 ASM International (AMS:ASM) Is Looking To Continue Growing Its Returns On Capital
What are the early trends we should look for to identify a stock that could multiply in value over the long term? Amongst other things, we'll want to see two things; firstly, a growing return on capital employed (ROCE) and secondly, an expansion in the company's amount of capital employed. Ultimately, this demonstrates that it's a business that is reinvesting profits at increasing rates of return. With that in mind, we've noticed some promising trends at ASM International (AMS:ASM) so let's look a bit deeper.
Understanding Return On Capital Employed (ROCE)
Just to clarify if you're unsure, ROCE is a metric for evaluating how much pre-tax income (in percentage terms) a company earns on the capital invested in its business. Analysts use this formula to calculate it for ASM International:
Return on Capital Employed = Earnings Before Interest and Tax (EBIT) ÷ (Total Assets - Current Liabilities)
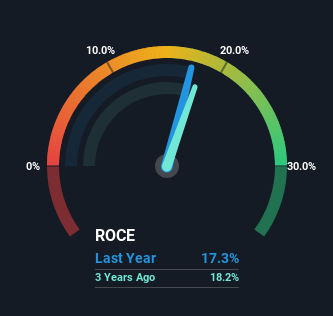
0.17 = €639m ÷ (€4.6b - €880m) (Based on the trailing twelve months to March 2024).
Thus, ASM International has an ROCE of 17%. In absolute terms, that's a satisfactory return, but compared to the Semiconductor industry average of 14% it's much better.
Check out our latest analysis for ASM International
Above you can see how the current ROCE for ASM International compares to its prior returns on capital, but there's only so much you can tell from the past. If you'd like to see what analysts are forecasting going forward, you should check out our free analyst report for ASM International .
What Does the ROCE Trend For ASM International Tell Us?
ASM International is displaying some positive trends. The data shows that returns on capital have increased substantially over the last five years to 17%. The amount of capital employed has increased too, by 111%. This can indicate that there's plenty of opportunities to invest capital internally and at ever higher rates, a combination that's common among multi-baggers.
The Key Takeaway
To sum it up, ASM International has proven it can reinvest in the business and generate higher returns on that capital employed, which is terrific. Since the stock has returned a staggering 1,121% to shareholders over the last five years, it looks like investors are recognizing these changes. So given the stock has proven it has promising trends, it's worth researching the company further to see if these trends are likely to persist.
If you'd like to know about the risks facing ASM International, we've discovered 1 warning sign that you should be aware of.
While ASM International isn't earning the highest return, check out this free list of companies that are earning high returns on equity with solid balance sheets.
Have feedback on this article? Concerned about the content? Get in touch with us directly. Alternatively, email editorial-team (at) simplywallst.com.
This article by Simply Wall St is general in nature. We provide commentary based on historical data and analyst forecasts only using an unbiased methodology and our articles are not intended to be financial advice. It does not constitute a recommendation to buy or sell any stock, and does not take account of your objectives, or your financial situation. We aim to bring you long-term focused analysis driven by fundamental data. Note that our analysis may not factor in the latest price-sensitive company announcements or qualitative material. Simply Wall St has no position in any stocks mentioned.
