
 Yahoo Finance
 Arko (NASDAQ:ARKO) Is Doing The Right Things To Multiply Its Share Price
If we want to find a potential multi-bagger, often there are underlying trends that can provide clues. Firstly, we'd want to identify a growing return on capital employed (ROCE) and then alongside that, an ever-increasing base of capital employed. This shows us that it's a compounding machine, able to continually reinvest its earnings back into the business and generate higher returns. With that in mind, we've noticed some promising trends at Arko (NASDAQ:ARKO) so let's look a bit deeper.
Understanding Return On Capital Employed (ROCE)
For those who don't know, ROCE is a measure of a company's yearly pre-tax profit (its return), relative to the capital employed in the business. Analysts use this formula to calculate it for Arko:
Return on Capital Employed = Earnings Before Interest and Tax (EBIT) ÷ (Total Assets - Current Liabilities)
0.06 = US$151m ÷ (US$2.9b - US$429m) (Based on the trailing twelve months to March 2022).
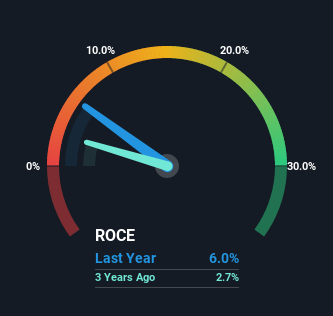
So, Arko has an ROCE of 6.0%. In absolute terms, that's a low return and it also under-performs the Specialty Retail industry average of 18%.
View our latest analysis for Arko
Above you can see how the current ROCE for Arko compares to its prior returns on capital, but there's only so much you can tell from the past. If you'd like to see what analysts are forecasting going forward, you should check out our free report for Arko.
So How Is Arko's ROCE Trending?
Even though ROCE is still low in absolute terms, it's good to see it's heading in the right direction. Over the last five years, returns on capital employed have risen substantially to 6.0%. The amount of capital employed has increased too, by 355%. The increasing returns on a growing amount of capital is common amongst multi-baggers and that's why we're impressed.
In another part of our analysis, we noticed that the company's ratio of current liabilities to total assets decreased to 15%, which broadly means the business is relying less on its suppliers or short-term creditors to fund its operations. So shareholders would be pleased that the growth in returns has mostly come from underlying business performance.
The Key Takeaway
All in all, it's terrific to see that Arko is reaping the rewards from prior investments and is growing its capital base. And since the stock has fallen 13% over the last year, there might be an opportunity here. That being the case, research into the company's current valuation metrics and future prospects seems fitting.
On a separate note, we've found 1 warning sign for Arko you'll probably want to know about.
While Arko may not currently earn the highest returns, we've compiled a list of companies that currently earn more than 25% return on equity. Check out this free list here.
Have feedback on this article? Concerned about the content? Get in touch with us directly. Alternatively, email editorial-team (at) simplywallst.com.
This article by Simply Wall St is general in nature. We provide commentary based on historical data and analyst forecasts only using an unbiased methodology and our articles are not intended to be financial advice. It does not constitute a recommendation to buy or sell any stock, and does not take account of your objectives, or your financial situation. We aim to bring you long-term focused analysis driven by fundamental data. Note that our analysis may not factor in the latest price-sensitive company announcements or qualitative material. Simply Wall St has no position in any stocks mentioned.
