
 Yahoo Finance
 Can ARB Corporation Limited (ASX:ARB) Maintain Its Strong Returns?

Want to participate in a short research study? Help shape the future of investing tools and you could win a $250 gift card!
While some investors are already well versed in financial metrics (hat tip), this article is for those who would like to learn about Return On Equity (ROE) and why it is important. To keep the lesson grounded in practicality, we'll use ROE to better understand ARB Corporation Limited (ASX:ARB).
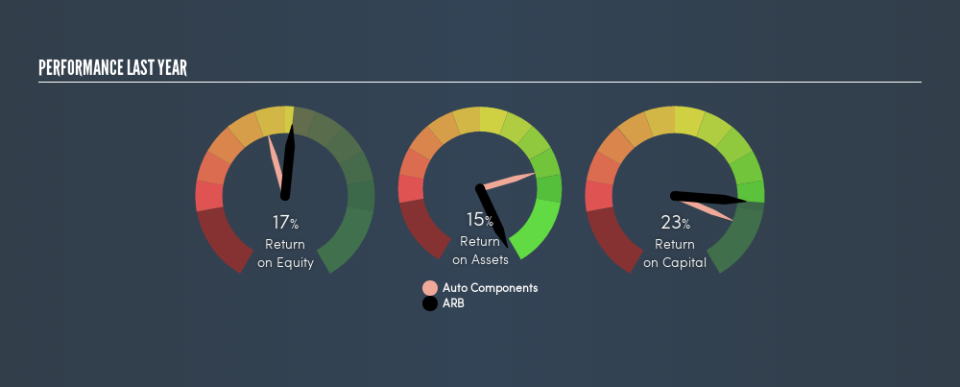
Over the last twelve months ARB has recorded a ROE of 17%. Another way to think of that is that for every A$1 worth of equity in the company, it was able to earn A$0.17.
View our latest analysis for ARB
How Do I Calculate ROE?
The formula for ROE is:
Return on Equity = Net Profit ÷ Shareholders' Equity
Or for ARB:
17% = AU$55m ÷ AU$324m (Based on the trailing twelve months to December 2018.)
Most readers would understand what net profit is, but it’s worth explaining the concept of shareholders’ equity. It is the capital paid in by shareholders, plus any retained earnings. Shareholders' equity can be calculated by subtracting the total liabilities of the company from the total assets of the company.
What Does ROE Signify?
ROE measures a company's profitability against the profit it retains, and any outside investments. The 'return' is the profit over the last twelve months. The higher the ROE, the more profit the company is making. So, all else equal, investors should like a high ROE. That means ROE can be used to compare two businesses.
Does ARB Have A Good Return On Equity?
One simple way to determine if a company has a good return on equity is to compare it to the average for its industry. However, this method is only useful as a rough check, because companies do differ quite a bit within the same industry classification. As is clear from the image below, ARB has a better ROE than the average (14%) in the Auto Components industry.
That's what I like to see. We think a high ROE, alone, is usually enough to justify further research into a company. For example, I often check if insiders have been buying shares .
How Does Debt Impact ROE?
Companies usually need to invest money to grow their profits. That cash can come from retained earnings, issuing new shares (equity), or debt. In the first and second cases, the ROE will reflect this use of cash for investment in the business. In the latter case, the debt required for growth will boost returns, but will not impact the shareholders' equity. That will make the ROE look better than if no debt was used.
Combining ARB's Debt And Its 17% Return On Equity
While ARB does have a tiny amount of debt, with debt to equity of just 0.0077, we think the use of debt is very modest. The combination of modest debt and a very respectable ROE suggests this is a business worth watching. Careful use of debt to boost returns is often very good for shareholders. However, it could reduce the company's ability to take advantage of future opportunities.
The Bottom Line On ROE
Return on equity is one way we can compare the business quality of different companies. Companies that can achieve high returns on equity without too much debt are generally of good quality. All else being equal, a higher ROE is better.
But when a business is high quality, the market often bids it up to a price that reflects this. The rate at which profits are likely to grow, relative to the expectations of profit growth reflected in the current price, must be considered, too. So I think it may be worth checking this free report on analyst forecasts for the company.
Of course, you might find a fantastic investment by looking elsewhere. So take a peek at this free list of interesting companies.
We aim to bring you long-term focused research analysis driven by fundamental data. Note that our analysis may not factor in the latest price-sensitive company announcements or qualitative material.
If you spot an error that warrants correction, please contact the editor at editorial-team@simplywallst.com. This article by Simply Wall St is general in nature. It does not constitute a recommendation to buy or sell any stock, and does not take account of your objectives, or your financial situation. Simply Wall St has no position in the stocks mentioned. Thank you for reading.
