
 Yahoo Finance
 Apogee (APOG) Q2 Earnings Top Estimates, FY23 EPS View Up
Apogee Enterprises, Inc. APOG reported adjusted earnings per share (EPS) of $1.06 for second-quarter fiscal 2023 (ended Aug 27, 2022), surpassing the Zacks Consensus Estimate of 89 cents. This compares favorably with our estimate of 89 cents for the fiscal second quarter. The bottom line surged 100% from the prior-year fiscal quarter’s 53 cents.
Including one-time items, earnings in the fiscal quarter under review were $1.68 against the loss per share of 8 cents incurred in the last fiscal year’s comparable quarter.
Apogee generated record revenues of $372 million in the fiscal quarter under review, up 14% from the year-ago fiscal quarter’s tally on solid growth in the Architectural Framing Systems and Architectural Services. The top-line figure beat the Zacks Consensus Estimate of $357 million. Our estimate for the quarter was $356.7 million.
Apogee Enterprises, Inc. Price, Consensus and EPS Surprise
Apogee Enterprises, Inc. price-consensus-eps-surprise-chart | Apogee Enterprises, Inc. Quote
Operational Update
Cost of sales in the fiscal first quarter moved up 3% from the prior-year fiscal quarter’s actuals to $287 million. Gross profit increased 77% from the prior-year fiscal quarter’s reading to $85 million. The gross margin expanded to 22.8% in the fiscal quarter from the prior-year fiscal quarter's 14.7%.
Selling, general and administrative (SG&A) expenses moved up 3.5% from the prior-year fiscal quarter’s level to $53 million. The adjusted operating income rose 81% from the year-earlier fiscal quarter’s actuals to $32 million. The operating margin in the reported fiscal quarter was 8.6% compared with the prior-year fiscal quarter's 5.4%.
Segment Performance
In the fiscal second quarter, revenues in the Architectural Framing Systems segment climbed 26% from the prior-year fiscal quarter’s actuals to $173 million. The segment's adjusted operating profit was $20.5 million compared with the year-ago quarter's $10.4 million.
Revenues in the Architectural Glass segment declined 8% from the prior-year fiscal quarter’s actuals to $76 million due to lower volumes. The segment reported an adjusted operating income of $6.5 million, up from $0.4 million in the second quarter of fiscal 2022.
Revenues in the Architectural Services segment rose 11% from the prior-year fiscal quarter’s actuals to a record $107 million. The segment's operating profit declined 23% from the prior-year fiscal quarter’s level to $5.5 million.
Revenues in the Large-Scale Optical Technologies segment were up 7% from the prior-year fiscal quarter’s reported number to $25 million. The segment posted an operating profit of $6 million in the fiscal second quarter compared with the prior-year fiscal quarter's $5.5 million.
Backlog
The Architectural Services segment's backlog came in at $785 million at the end of the fiscal second quarter compared with $681 million at the end of the first quarter of fiscal 2023. Backlog in the Architectural Framing segment amounted to $286 million, down from $310 million at the end of first-quarter fiscal 2023.
Financial Position
Apogee had cash and cash equivalents of $22 million at the end of second-quarter fiscal 2023 compared with $38 million at the end of fiscal 2022. Cash utilized in operating activities was $2.6 million in the first half of fiscal 2023 compared with the prior-year comparable fiscal period’s cash inflow of $55 million.
Long-term debt was $251 million at the end of second-quarter fiscal 2023 compared with $162 million at the end of fiscal 2022.
Apogee returned around $84 million of cash to its shareholders in the first half of fiscal 2023 through dividend payments and share repurchases.
Fiscal 2023 Guidance
Apogee now expects fiscal 2023 adjusted EPS between $3.75 and $4.05, up from the prior guided range of $3.50-$3.90. APOG anticipates revenue growth of 8-10% for the full fiscal, to be primarily driven by Architectural Framing Systems. Management projects capital expenditures at around $40 million for fiscal 2023.
Price Performance
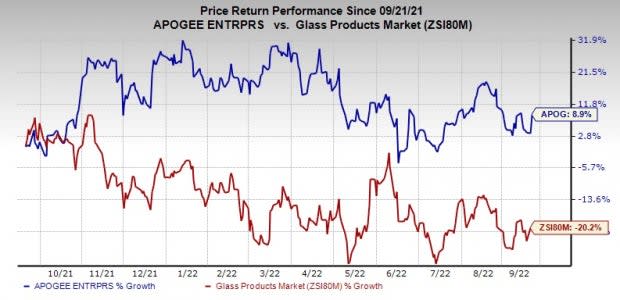
Image Source: Zacks Investment Research
Shares of Apogee have gained 8.9% in the past year against the industry's decline of 20.2%.
Zacks Rank & Stocks to Consider
Apogee currently carries a Zacks Rank #3 (Hold). Some better-ranked stocks in the Industrial Products sector are RBC Bearings Incorporated ROLL, Valmont Industries, Inc. VMI and Greif, Inc. GEF. While ROLL sports a Zacks Rank #1 (Strong Buy), VMI and GEF carry a Zacks Rank #2 (Buy) at present. You can see the complete list of today’s Zacks #1 Rank stocks here.
RBC Bearings delivered a trailing four-quarter earnings surprise of 9.4%, on average. Earnings estimates have increased 31.1% for fiscal 2023 (ending March 2023) in the past 60 days. ROLL’s shares have gained 23% in the past year.
Valmont Industries’ earnings surprise in the last four quarters was 13.7%, on average. In the past 60 days, its earnings estimates have increased 4.3% for 2022. The VMI stock has rallied 15% in the past year.
Greif delivered a trailing four-quarter earnings surprise of 22.4%, on average. Earnings estimates have increased 4.6% for fiscal 2022 (ending October 2022) in the past 60 days. GEF’s shares have risen 5% in the past year.
Want the latest recommendations from Zacks Investment Research? Today, you can download 7 Best Stocks for the Next 30 Days. Click to get this free report
Valmont Industries, Inc. (VMI) : Free Stock Analysis Report
Apogee Enterprises, Inc. (APOG) : Free Stock Analysis Report
Greif, Inc. (GEF) : Free Stock Analysis Report
RBC Bearings Incorporated (ROLL) : Free Stock Analysis Report
To read this article on Zacks.com click here.
Zacks Investment Research
