
 Yahoo Finance
 What Do Analysts Think About FAR Limited's (ASX:FAR) Long Term Outlook?

Want to participate in a short research study? Help shape the future of investing tools and you could win a $250 gift card!
The latest earnings release FAR Limited's (ASX:FAR) announced in December 2018 revealed company earnings became less negative compared to the previous year's level as a result of recent tailwinds Today I want to provide a brief commentary on how market analysts predict FAR's earnings growth trajectory over the next couple of years and whether the future looks brighter. I will be looking at earnings excluding extraordinary items to exclude one-off activities to get a better understanding of the underlying drivers of earnings.
Check out our latest analysis for FAR
Analysts' expectations for this coming year seems pessimistic, with earnings becoming even more negative, generating -AU$15.3m in 2020. However, earnings should move into an upward trajectory, reaching -AU$17.5m in 2021, before plateauing down to -AU$12.0m in 2022.
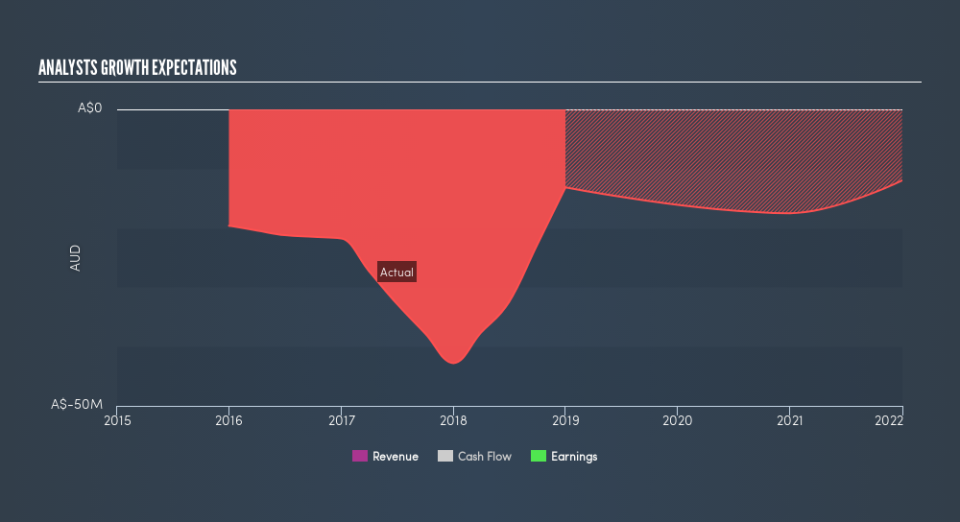
While it is helpful to be aware of the rate of growth year by year relative to today’s value, it may be more beneficial analyzing the rate at which the earnings are growing on average every year. The benefit of this approach is that we can get a better picture of the direction of FAR's earnings trajectory over the long run, irrespective of near term fluctuations, be more volatile. To compute this rate, I put a line of best fit through the forecasted earnings by market analysts. The slope of this line is the rate of earnings growth, which in this case is -4.1%. This means, we can anticipate FAR will chip away at a rate of -4.1% every year for the next few years.
Next Steps:
For FAR, I've compiled three important factors you should look at:
Financial Health: Does it have a healthy balance sheet? Take a look at our free balance sheet analysis with six simple checks on key factors like leverage and risk.
Future Earnings: How does FAR's growth rate compare to its peers and the wider market? Dig deeper into the analyst consensus number for the upcoming years by interacting with our free analyst growth expectation chart.
Other High-Growth Alternatives: Are there other high-growth stocks you could be holding instead of FAR? Explore our interactive list of stocks with large growth potential to get an idea of what else is out there you may be missing!
We aim to bring you long-term focused research analysis driven by fundamental data. Note that our analysis may not factor in the latest price-sensitive company announcements or qualitative material.
If you spot an error that warrants correction, please contact the editor at editorial-team@simplywallst.com. This article by Simply Wall St is general in nature. It does not constitute a recommendation to buy or sell any stock, and does not take account of your objectives, or your financial situation. Simply Wall St has no position in the stocks mentioned. Thank you for reading.
