
 Yahoo Finance
 Analysts Expect PayGroup Limited (ASX:PYG) To Breakeven Soon
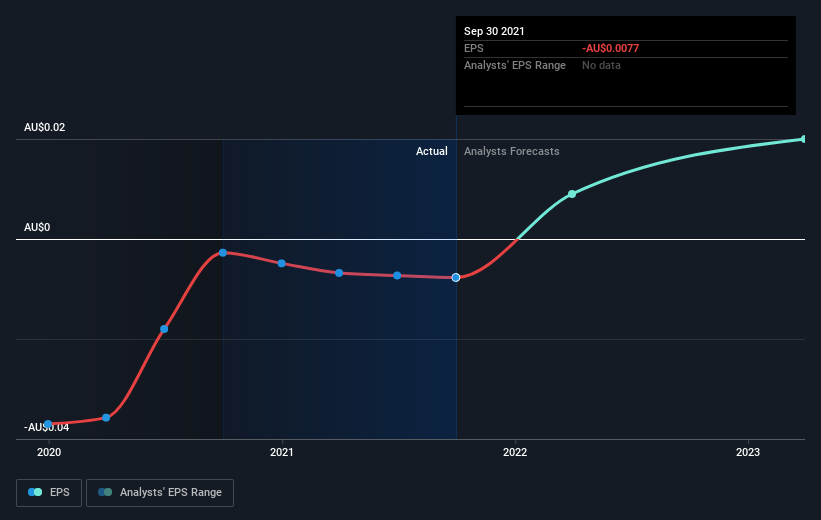
We feel now is a pretty good time to analyse PayGroup Limited's (ASX:PYG) business as it appears the company may be on the cusp of a considerable accomplishment. PayGroup Limited provides payroll and human capital management solutions in the Asia Pacific and the Middle East. The AU$49m market-cap company posted a loss in its most recent financial year of AU$511k and a latest trailing-twelve-month loss of AU$727k leading to an even wider gap between loss and breakeven. The most pressing concern for investors is PayGroup's path to profitability – when will it breakeven? We've put together a brief outline of industry analyst expectations for the company, its year of breakeven and its implied growth rate.
View our latest analysis for PayGroup
According to some industry analysts covering PayGroup, breakeven is near. They anticipate the company to incur a final loss in 2021, before generating positive profits of AU$1.0m in 2022. The company is therefore projected to breakeven around 12 months from now or less. At what rate will the company have to grow in order to realise the consensus estimates forecasting breakeven in under 12 months? Using a line of best fit, we calculated an average annual growth rate of 143%, which signals high confidence from analysts. Should the business grow at a slower rate, it will become profitable at a later date than expected.
Underlying developments driving PayGroup's growth isn’t the focus of this broad overview, however, bear in mind that generally a high forecast growth rate is not unusual for a company that is currently undergoing an investment period.
Before we wrap up, there’s one aspect worth mentioning. PayGroup currently has no debt on its balance sheet, which is quite unusual for a cash-burning growth company, which usually has a high level of debt relative to its equity. This means that the company has been operating purely on its equity investment and has no debt burden. This aspect reduces the risk around investing in the loss-making company.
Next Steps:
This article is not intended to be a comprehensive analysis on PayGroup, so if you are interested in understanding the company at a deeper level, take a look at PayGroup's company page on Simply Wall St. We've also compiled a list of pertinent factors you should further research:
Valuation: What is PayGroup worth today? Has the future growth potential already been factored into the price? The intrinsic value infographic in our free research report helps visualize whether PayGroup is currently mispriced by the market.
Management Team: An experienced management team on the helm increases our confidence in the business – take a look at who sits on PayGroup’s board and the CEO’s background.
Other High-Performing Stocks: Are there other stocks that provide better prospects with proven track records? Explore our free list of these great stocks here.
This article by Simply Wall St is general in nature. We provide commentary based on historical data and analyst forecasts only using an unbiased methodology and our articles are not intended to be financial advice. It does not constitute a recommendation to buy or sell any stock, and does not take account of your objectives, or your financial situation. We aim to bring you long-term focused analysis driven by fundamental data. Note that our analysis may not factor in the latest price-sensitive company announcements or qualitative material. Simply Wall St has no position in any stocks mentioned.
Have feedback on this article? Concerned about the content? Get in touch with us directly. Alternatively, email editorial-team (at) simplywallst.com.
