
 Yahoo Finance
 Amidst increasing losses, Investors bid up Bridge SaaS (ASX:BGE) 13% this past week
This month, we saw the Bridge SaaS Limited (ASX:BGE) up an impressive 142%. But that doesn't change the fact that the returns over the last year have been less than pleasing. After all, the share price is down 30% in the last year, significantly under-performing the market.
While the last year has been tough for Bridge SaaS shareholders, this past week has shown signs of promise. So let's look at the longer term fundamentals and see if they've been the driver of the negative returns.
View our latest analysis for Bridge SaaS
We don't think Bridge SaaS' revenue of AU$1,414,224 is enough to establish significant demand. You have to wonder why venture capitalists aren't funding it. As a result, we think it's unlikely shareholders are paying much attention to current revenue, but rather speculating on growth in the years to come. It seems likely some shareholders believe that Bridge SaaS will significantly advance the business plan before too long.
As a general rule, if a company doesn't have much revenue, and it loses money, then it is a high risk investment. We can see that they needed to raise more capital, and took that step recently despite the fact that it would have been dilutive to current holders. While some such companies do very well over the long term, others become hyped up by promoters before eventually falling back down to earth, and going bankrupt (or being recapitalized).
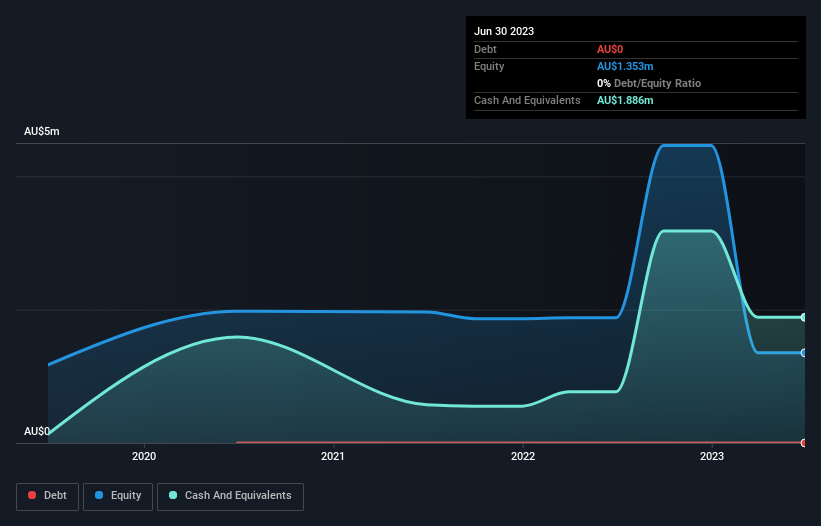
When it last reported, Bridge SaaS had minimal cash in excess of all liabilities. So it's prudent that the management team has already moved to replenish reserves through the recent capital raising event. With that in mind, you can imagine there may be other factors that caused the share price to drop 30% in the last year. The image below shows how Bridge SaaS' balance sheet has changed over time; if you want to see the precise values, simply click on the image.
Of course, the truth is that it is hard to value companies without much revenue or profit. What if insiders are ditching the stock hand over fist? I'd like that just about as much as I like to drink milk and fruit juice mixed together. You can click here to see if there are insiders selling.
What About The Total Shareholder Return (TSR)?
Investors should note that there's a difference between Bridge SaaS' total shareholder return (TSR) and its share price change, which we've covered above. The TSR is a return calculation that accounts for the value of cash dividends (assuming that any dividend received was reinvested) and the calculated value of any discounted capital raisings and spin-offs. Bridge SaaS hasn't been paying dividends, but its TSR of -19% exceeds its share price return of -30%, implying it has either spun-off a business, or raised capital at a discount; thereby providing additional value to shareholders.
A Different Perspective
While Bridge SaaS shareholders are down 19% for the year, the market itself is up 8.8%. However, keep in mind that even the best stocks will sometimes underperform the market over a twelve month period. It's great to see a nice little 62% rebound in the last three months. Let's just hope this isn't the widely-feared 'dead cat bounce' (which would indicate further declines to come). I find it very interesting to look at share price over the long term as a proxy for business performance. But to truly gain insight, we need to consider other information, too. Consider for instance, the ever-present spectre of investment risk. We've identified 5 warning signs with Bridge SaaS , and understanding them should be part of your investment process.
For those who like to find winning investments this free list of growing companies with recent insider purchasing, could be just the ticket.
Please note, the market returns quoted in this article reflect the market weighted average returns of stocks that currently trade on Australian exchanges.
Have feedback on this article? Concerned about the content? Get in touch with us directly. Alternatively, email editorial-team (at) simplywallst.com.
This article by Simply Wall St is general in nature. We provide commentary based on historical data and analyst forecasts only using an unbiased methodology and our articles are not intended to be financial advice. It does not constitute a recommendation to buy or sell any stock, and does not take account of your objectives, or your financial situation. We aim to bring you long-term focused analysis driven by fundamental data. Note that our analysis may not factor in the latest price-sensitive company announcements or qualitative material. Simply Wall St has no position in any stocks mentioned.
