
 Yahoo Finance
 How American Railcar Industries Inc’s (NASDAQ:ARII) Earnings Growth Stacks Up Against The Industry

Analyzing American Railcar Industries Inc’s (NASDAQ:ARII) track record of past performance is a valuable exercise for investors. It enables us to reflect on whether or not the company has met expectations, which is a powerful signal for future performance. Today I will assess ARII’s recent performance announced on 30 June 2018 and compare these figures to its long-term trend and industry movements.
View our latest analysis for American Railcar Industries
Were ARII’s earnings stronger than its past performances and the industry?
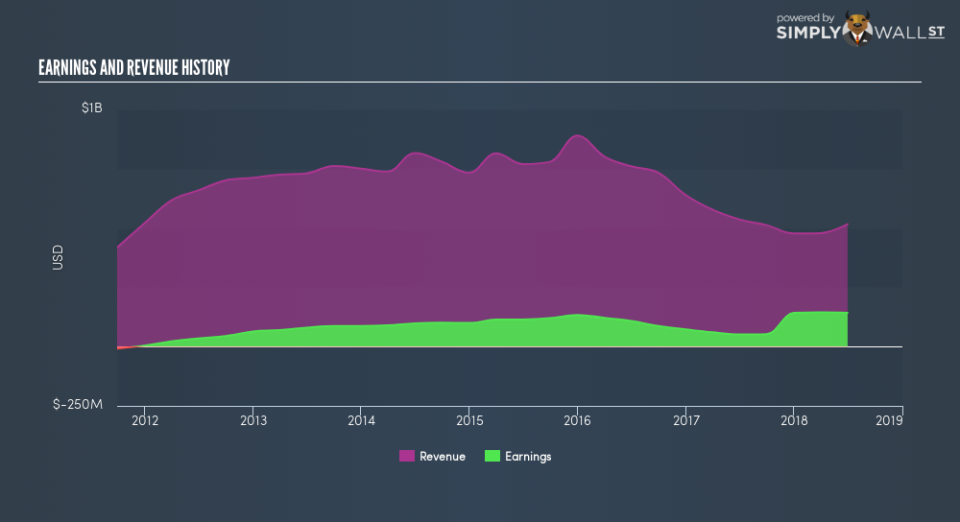
ARII’s trailing twelve-month earnings (from 30 June 2018) of US$142.9m has more than doubled from US$72.7m in the prior year. Furthermore, this one-year growth rate has exceeded its 5-year annual growth average of 15.6%, indicating the rate at which ARII is growing has accelerated. How has it been able to do this? Let’s see whether it is merely owing to industry tailwinds, or if American Railcar Industries has seen some company-specific growth.
Over the last couple of years, American Railcar Industries increased bottom-line, while its top-line fell, by successfully managing its costs. This resulted in to a margin expansion and profitability over time. Inspecting growth from a sector-level, the US machinery industry has been growing its average earnings by double-digit 23.2% over the past twelve months, and a more subdued 5.6% over the last five years. This growth is a median of profitable companies of 25 Machinery companies in US including COSCO Shipping International (Singapore), IHI and Omni-Lite Industries Canada. This means whatever uplift the industry is gaining from, American Railcar Industries is capable of amplifying this to its advantage.
In terms of returns from investment, American Railcar Industries has invested its equity funds well leading to a 21.3% return on equity (ROE), above the sensible minimum of 20%. Furthermore, its return on assets (ROA) of 11.0% exceeds the US Machinery industry of 6.2%, indicating American Railcar Industries has used its assets more efficiently. However, its return on capital (ROC), which also accounts for American Railcar Industries’s debt level, has declined over the past 3 years from 14.4% to 4.3%. This correlates with an increase in debt holding, with debt-to-equity ratio rising from 49.7% to 79.5% over the past 5 years.
What does this mean?
American Railcar Industries’s track record can be a valuable insight into its earnings performance, but it certainly doesn’t tell the whole story. Positive growth and profitability are what investors like to see in a company’s track record, but how do we properly assess sustainability? I recommend you continue to research American Railcar Industries to get a better picture of the stock by looking at:
Future Outlook: What are well-informed industry analysts predicting for ARII’s future growth? Take a look at our free research report of analyst consensus for ARII’s outlook.
Financial Health: Are ARII’s operations financially sustainable? Balance sheets can be hard to analyze, which is why we’ve done it for you. Check out our financial health checks here.
Other High-Performing Stocks: Are there other stocks that provide better prospects with proven track records? Explore our free list of these great stocks here.
NB: Figures in this article are calculated using data from the trailing twelve months from 30 June 2018. This may not be consistent with full year annual report figures.
To help readers see past the short term volatility of the financial market, we aim to bring you a long-term focused research analysis purely driven by fundamental data. Note that our analysis does not factor in the latest price-sensitive company announcements.
The author is an independent contributor and at the time of publication had no position in the stocks mentioned. For errors that warrant correction please contact the editor at editorial-team@simplywallst.com.